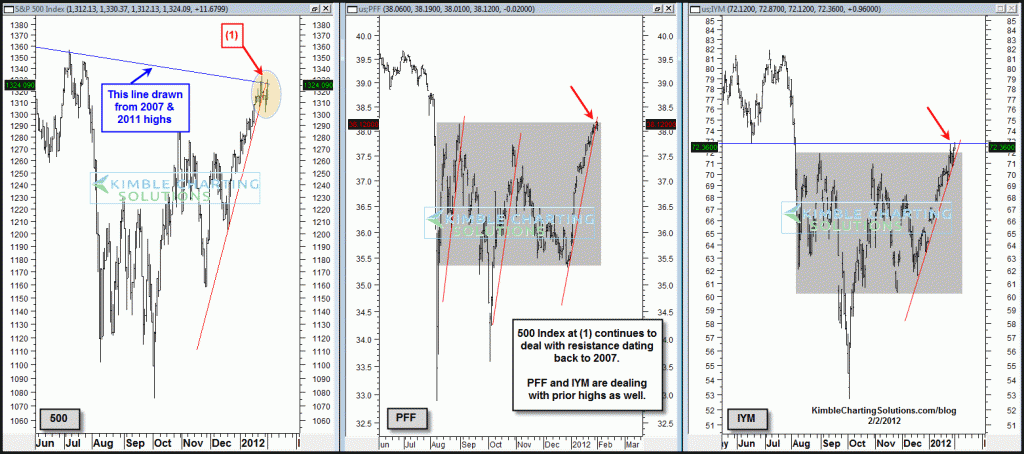
In the movie Groundhog Day, actor Bill Murray plays a weatherman, which finds himself living the same day over and over again. The 3-pack below reflects that many key markets are experiencing the same thing…resistance-
CLICK ON CHART TO ENLARGE
Prices moved higher yesterday which was a positve. The 500 index, Preferred stock ETF (PFF) and Basic Materials (IYM) continue to deal with resistance. Actor Bill Murray found his life boring as the same day kept happening over and over again, which reminds me a little bit of the markets of late!
Odds are increasing that these patterns will come to an end soon, due to the intersection of support and resistance is at hand!
The key battle now boils down too….Will positive momentum (which the markets have at this time) be strong enough to get past the technical resistance. Keep in mind if momentum can push above resistance, momentum players and the technical crowd will join sides and they should push prices a good deal higher.


Belsha…
The AUD$/500 chart reflects that the 500 index is back at 2011 highs, as you mentioned. (see post here)
From a momentum standpoint, is it bad to see banks and real estate breaking above resistance? What about PFF and IYM? (see ground hog resistance)
I don’t know how high this market could rally. I did suggest on 1/18 to be “Open Minded” to an upside breakout that could be influenced by a short covering rally in the Euro (see post here)
What can be hard to believe yet it is true, in the above mentioned Euro/Open minded chart, the last two times the Euro formed a big-time falling wedge, the 500 index rallied at least 25% in value!
Could it be a fakeout? Anything is possible and that is what makes all of this so much fun! 🙂
“Tops are usually a process and Bottoms are usually Events” Ole Mo is keeping the process moving higher at this point.
Chris
Looks like the SP broak above 2007-2011 resistance today…. till were can this go, or could it be a fakeout?