CLICK ON CHART TO ENLARGE
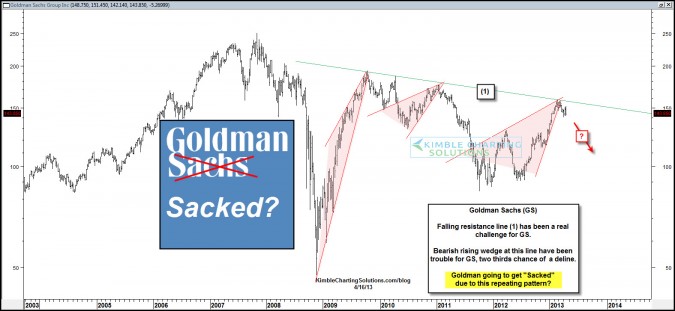
Goldman Sachs has really struggled with resistance line (1) over the past few years, topping out, creating a series of lower highs and bearish rising wedges….resulting in pretty steep declines.
Now GS is back at line (1) again and has created another bearish rising wedge, which suggest lower prices around two-thirds of the time! I shared this chart on Stocktwits. and Twitter yesterday. Today GS is soft, down more than SPY.
Goldman isn’t the only one creating patterns that are important for the banking industry…see below.
CLICK ON CHART TO ENLARGE
GS has broken support! Bank Index (BKX) and Financial ETF (XLF) HAVE NOT at this time. These patterns above are critical for the banking sector and the broad market. So goes the banks, so goes the major market index’s!
If the 2-pack above breaks support GS will get sacked… again!
–


