CLICK ON CHART TO ENLARGE
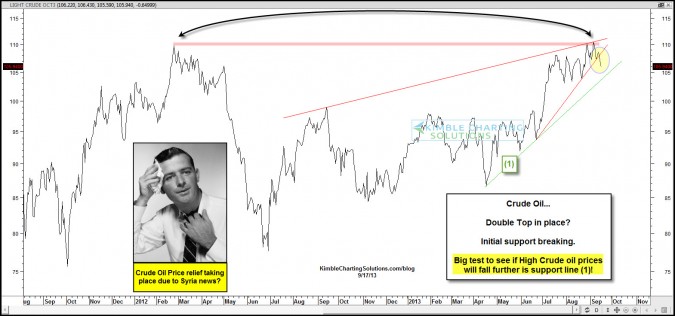
Crude Oil might have created a double top in the chart above.
At this time it is too soon to tell. A small rising support line is breaking of late. The odds of a double top would increase if Crude Oil happens to take out rising support line (1), which has to happen for crude to fall further in price.
CLICK ON CHART TO ENLARGE
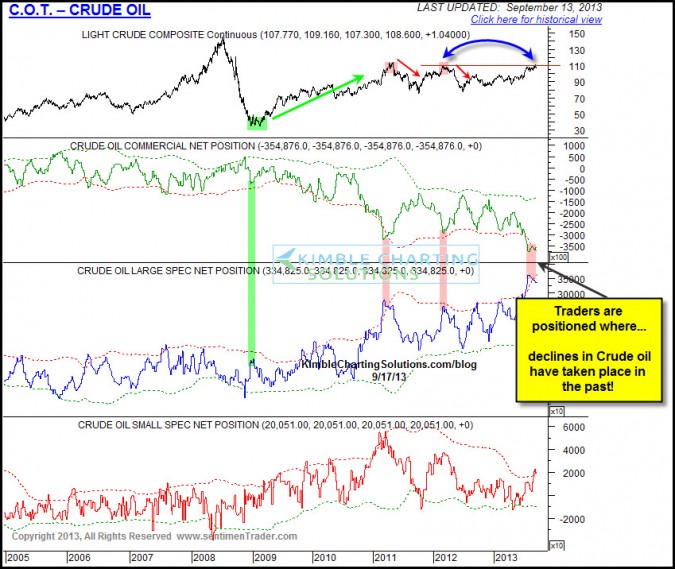
Traders have established positions that Crude Oil has declined in price over the past few years in the chart above.
Something to chew on and think about.…What is the correlation of Crude oil to stocks of late? What is the correlation to Crude oil and bond prices of late?
–
–


