

CLICK ON CHART TO ENLARGE
The above table looks at the 9 S&P 500 sectors performance on a variety of time frames. This morning I am taking a look at the Materials sector. As you can see XLB is the second worst sector this year, only trailing the hard hit energy complex.
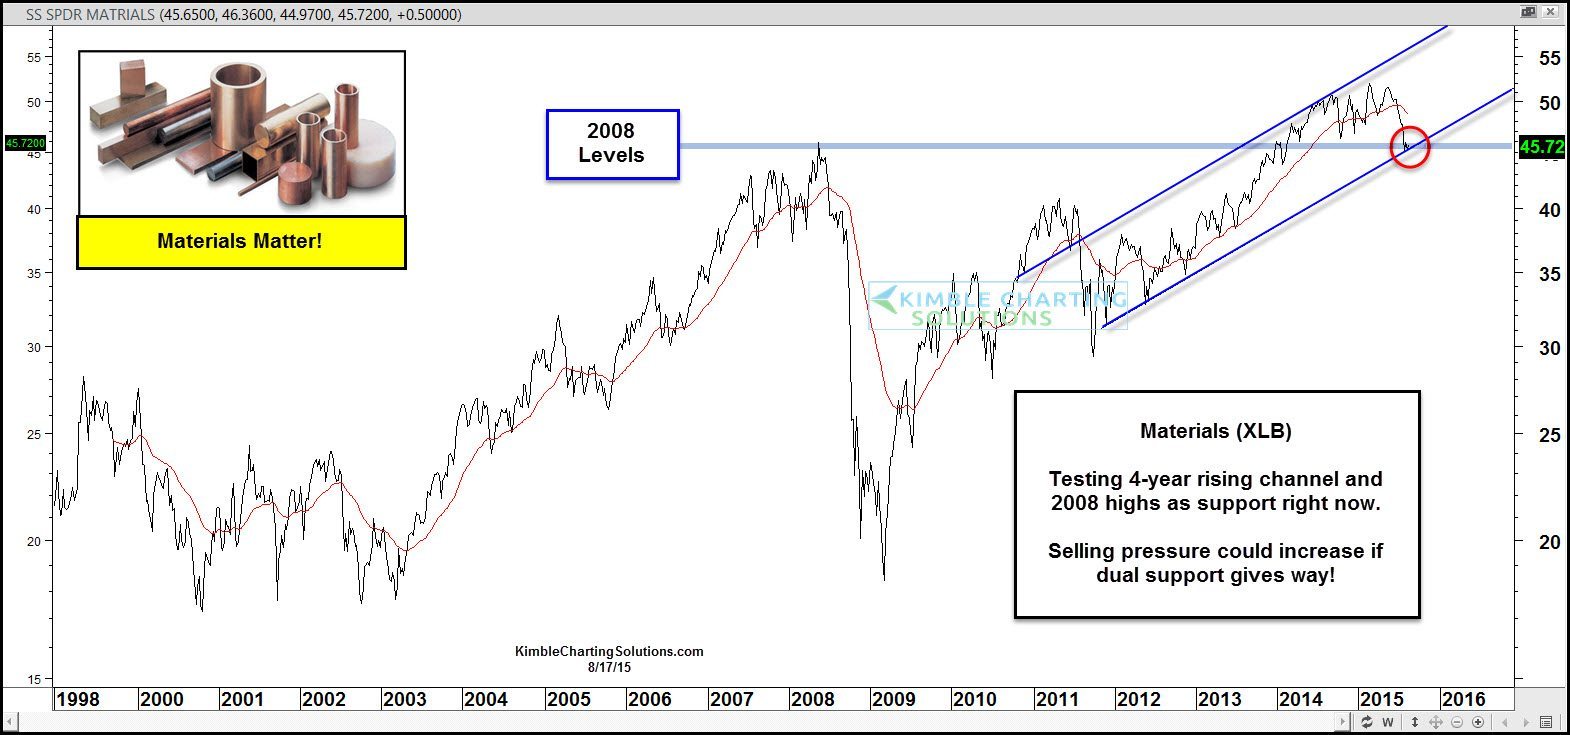
Could the poor performance get worse? The chart below looks at XLB and what could be a very important price point right now.
CLICK ON CHART TO ENLARGE
As you can see XLB is testing dual support right now and it is below its 200 Day moving average.
Even though this sector has been weak of late and this year, if dual support gives way, selling pressure could ramp up. Humbly I feel what materials do from here matters from a micro and big picture perspective.
What could do well if XLB breaks support? Bonds could be a beneficiary should it happen.
–
