

Energy stocks have not been a good buy and hold investment for the past few years. Looking back over the past 5-years, XLE has lagged all of the S&P 500 sectors and it is the only S&P sector that has a negative 5-year return. Could this trend be ending? A couple of things have caught our eye of late, from a Power of the Pattern perspective.
This chart looks at the performance of Crude Oil, two energy ETF’s and the S&P 500, since 3/27. Not seen this kind of energy strength over the broad market in a good while.
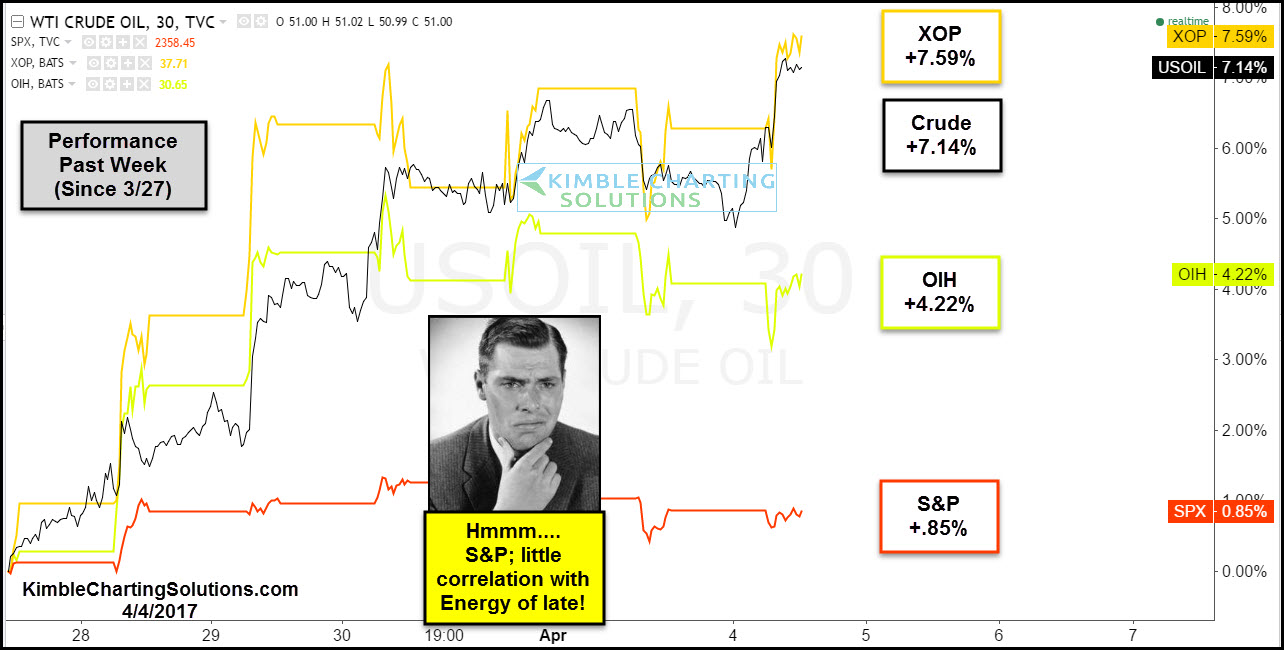
CLICK ON CHART TO ENLARGE
Below looks at the XOP/SPY ratio over the past three years. This chart reflects that XOP has been much weaker than the S&P since 2014.
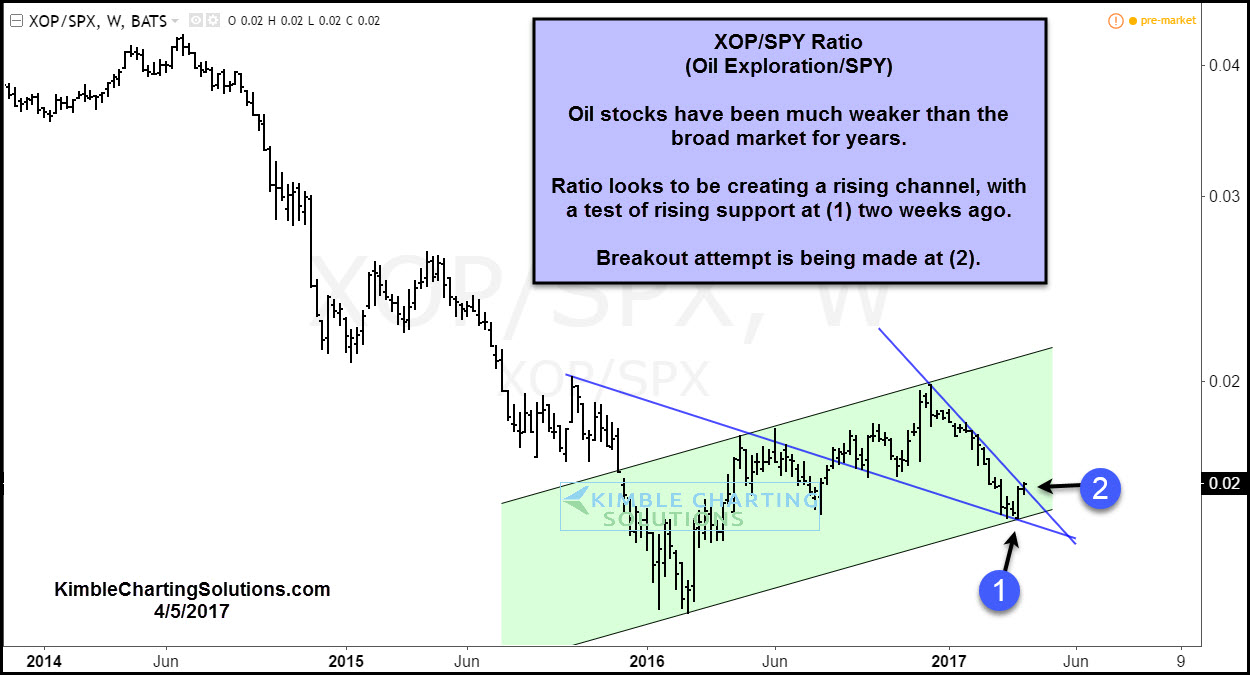
CLICK ON CHART TO ENLARGE
A year ago this ratio made a low and since then, it is attempting to create a series of higher lows and higher highs. The ratio hit rising channel support of late at (1) and it is now attempting to break above resistance of a bullish falling wedge at (2), which sends a bullish message to this sector.
The Power of the Pattern shared last week that a two-thirds chance of a bullish breakout was in play, see post HERE. A week later, the breakout of the bullish falling wedge is taking place.
Full Disclosure- Premium & Sector/Commodity Members are long this sector.
