

Below looks at the S&P 500 over the past couple of years on a weekly closing basis. The S&P hit a key level around 6-weeks ago and continues to “back off!”
CLICK ON CHART TO ENLARGE
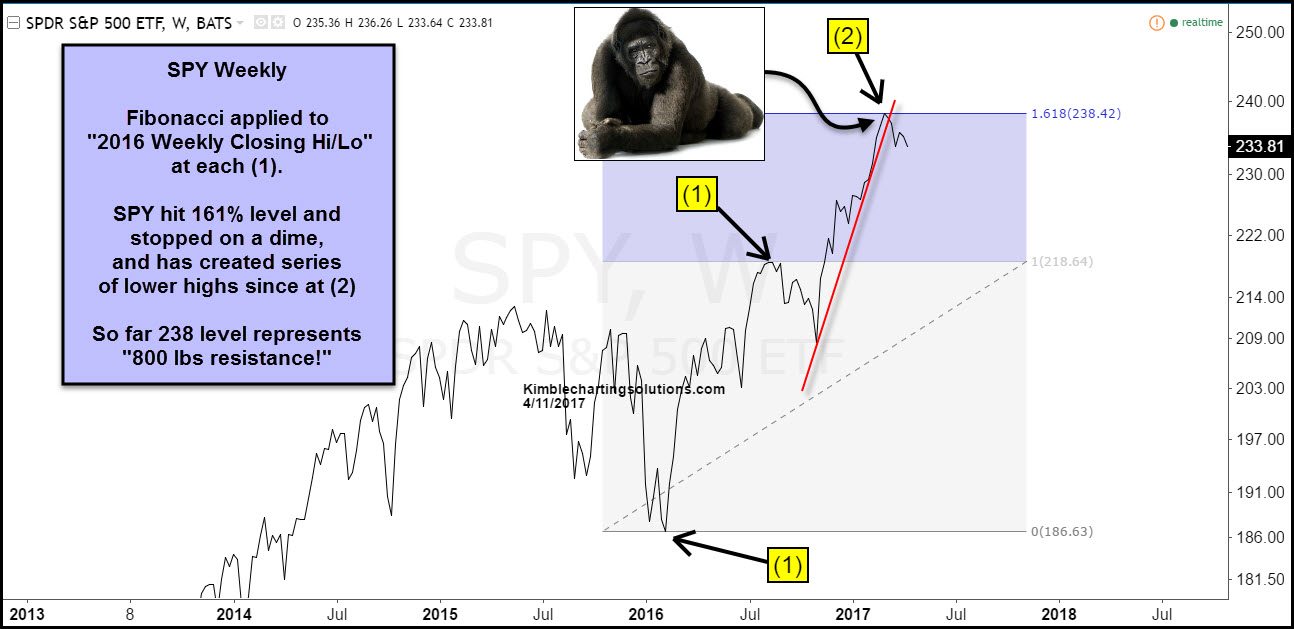
The Power of the Pattern applied Fibonacci to the 2016 “weekly closing highs and lows” at each (1), then applied the 161% extension level to them.
SPY hit the 161% extension level around 6 weeks ago, at the 238 level and has proceeded to create a series of lower highs, while breaking a steep rising support line at (2). This line was created off the lows at the time of the election.
Since hitting this key resistance level, the S&P 500 has created a series of “bearish reversal patterns/bearish wicks,” three out of the past 6-weeks! See post discussing bearish wicks HERE
Until the S&P can take out the 161% level, it comes into play as the 800 pound resistance zone.
