
Since the 2009 stock market lows, investors have looked to the Semiconductor sector for strong returns and market leadership.
Just check out the performance numbers vs the broader stock market: Semiconductor ETF (SMH) +494% vs S&P 500 +262%.
With numbers that double those of the S&P 500, it’s fair to say that the Semiconductors have provided important leadership for this bull market.
And that leadership has become much more apparent (and “visual”) in the past 18-24 months. Just look at that rally and outperformance! See chart below.
Semiconductors (SMH) vs Broader Market (SPX) Performance Chart
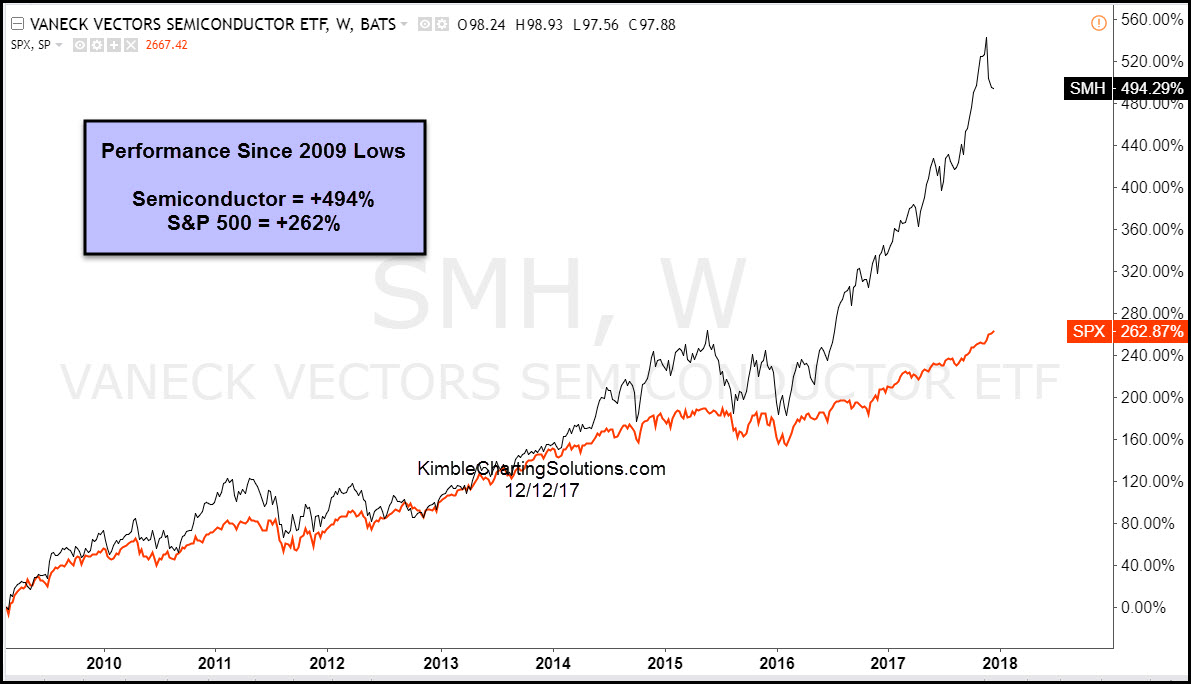
CLICK ON CHART TO ENLARGE
If you look closely at the chart above, you’ll note the recent downturn/pullback for SMH. That brings us to the importance of our next chart – a “monthly” bar chart that highlights why the Semiconductors have pulled back here.
Semiconductors Testing 2000 Highs
The Semiconductor ETF (SMH) recently tested its 2000 price highs (see points 1 & 2 on the chart below), before reversing lower to test uptrend price support (point 3). This action created a bearish reversal pattern and gave market bulls a strong reason to put SMH on their radar.
This post was originally created for See It Markets. To see the potential double top and rest of this post, CLICK HERE
