
 CLICK ON CHART TO ENLARGE
Some feel assets or charts have memories. If this is true, Tech bulls might be hoping that a certain level is forgotten!
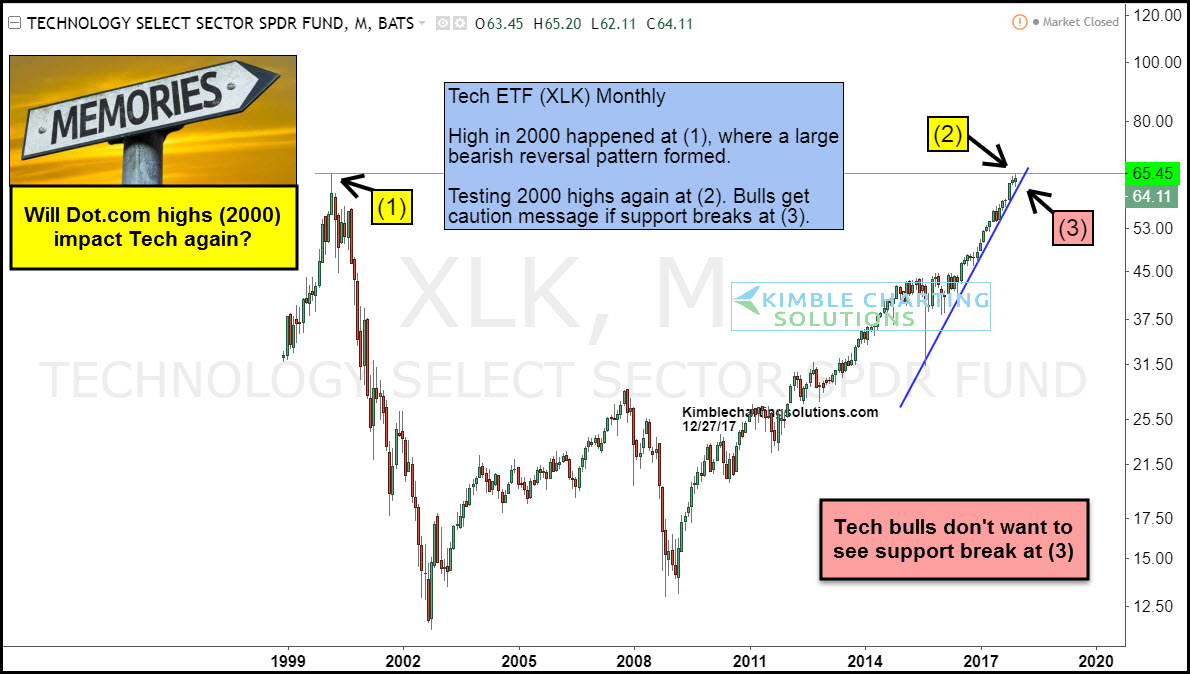
The above chart looks at Tech ETF (XLK) on a monthly basis, since 1998. XLK peaked at the 2000 highs at (1), where a bearish reversal pattern (bearish wick) took place. This monthly pattern ended up being the monthly high before the ETF declined over 80%.
17-years later, XLK finds itself testing the 2000 highs again this month at (2). Tech bulls wish for the New Year… They want this level to be forgotten and see a upside breakout.
Tech bulls would get a caution message if selling pressure would start and support would give way at (2)!
