CLICK ON CHART TO ENLARGE
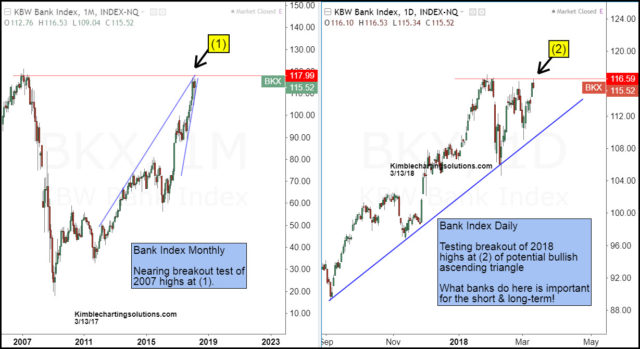
The 2-pack above looks at the Bank Index (BKX) on a monthly and daily basis. The monthly chart (left) highlights that the index is nearing the price level where it peaked in 2007 at (1). From a long-term perspective, this is an important test for this index and the broad market in general.
The daily chart (right) highlights that the index is testing 2018 highs at (2). The highs this year in the index could be the top of a bullish ascending triangle pattern. Two-thirds of the time, ascending triangle patterns breakout to the upside.
Bottom line- From a long and short-term perspective, banks are facing an important breakout or topping test.
–
View our most recent webinar multi-decade patterns in play and how to take advantage


