

CLICK ON CHART TO ENLARGE
The 2-pack above looks at the Dow from two different time frames. 100-year look back on the left and 35-year look back on the right. As you can see the Dow is in a very strong and well defined rising bull trend! Nothing of late has changed that!!! The strong rally since the 2009 lows has the Dow back at the top of this quality rising channel, attempting a breakout.
The left chart reflects that momentum is at levels seldom seen in the past 100-years. Other key times momentum was this high was back in 1929, 1987, 2000, 2007.
Joe Friday Just The Facts Ma’am- Bulls prefer to see breakouts, not selling getting started at (1)!
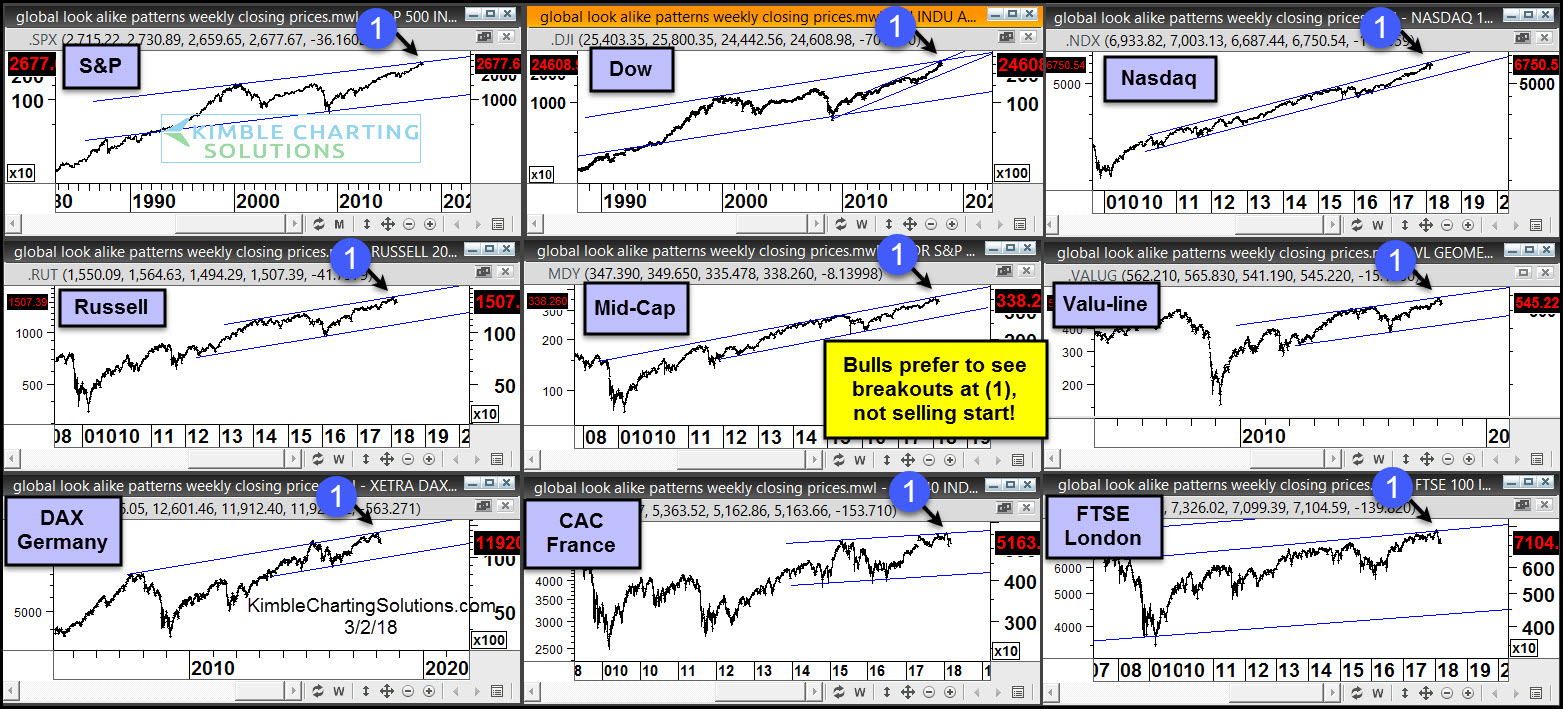
The 9-pack below looks at key stock indices around the world-
CLICK ON CHART TO ENLARGE
The 9-pack above reflects the world is highly correlated (Look Alike Patterns)!
Joe Friday Just The Facts Ma’am- Bulls prefer to see breakouts, not selling getting started at (1)!
If breakouts take place at each (1), would be super bullish news as markets around the world remain in uptrends!
View our most recent webinar multi-decade patterns in play and how to take advantage

–
