
Time frames are an important component of successful investing and research. And an investor’s perspective on a price trend depends very much on the time frame with they are looking at the given asset’s price.
This is very much true for today’s chart of the Thomson Reuters Equal Weighted Commodities Index.
On one hand, commodities have spent the majority of the past 30 years inside of a rising channel (1). On the other hand, commodities have spent the past 7 years in a downtrend channel, one that has carried the index back to the bottom side of the 30 year channel.
But commodities have been resilient, holding above their longer-term uptrend line and rallying back to test the upside of the 7-year downtrend channel at point (3). Note as well that the index is testing lateral price resistance.
If the commodities index breaks out above (3), it would likely signal the end of the 7-year downtrend and the beginning of a new bullish leg higher.
All in all, price is compressing and a breakout / breakdown resolution is becoming more and more likely.
Something’s gonna give soon… stay tuned!
TR Equal Weighted Commodities Index (1957 – Present)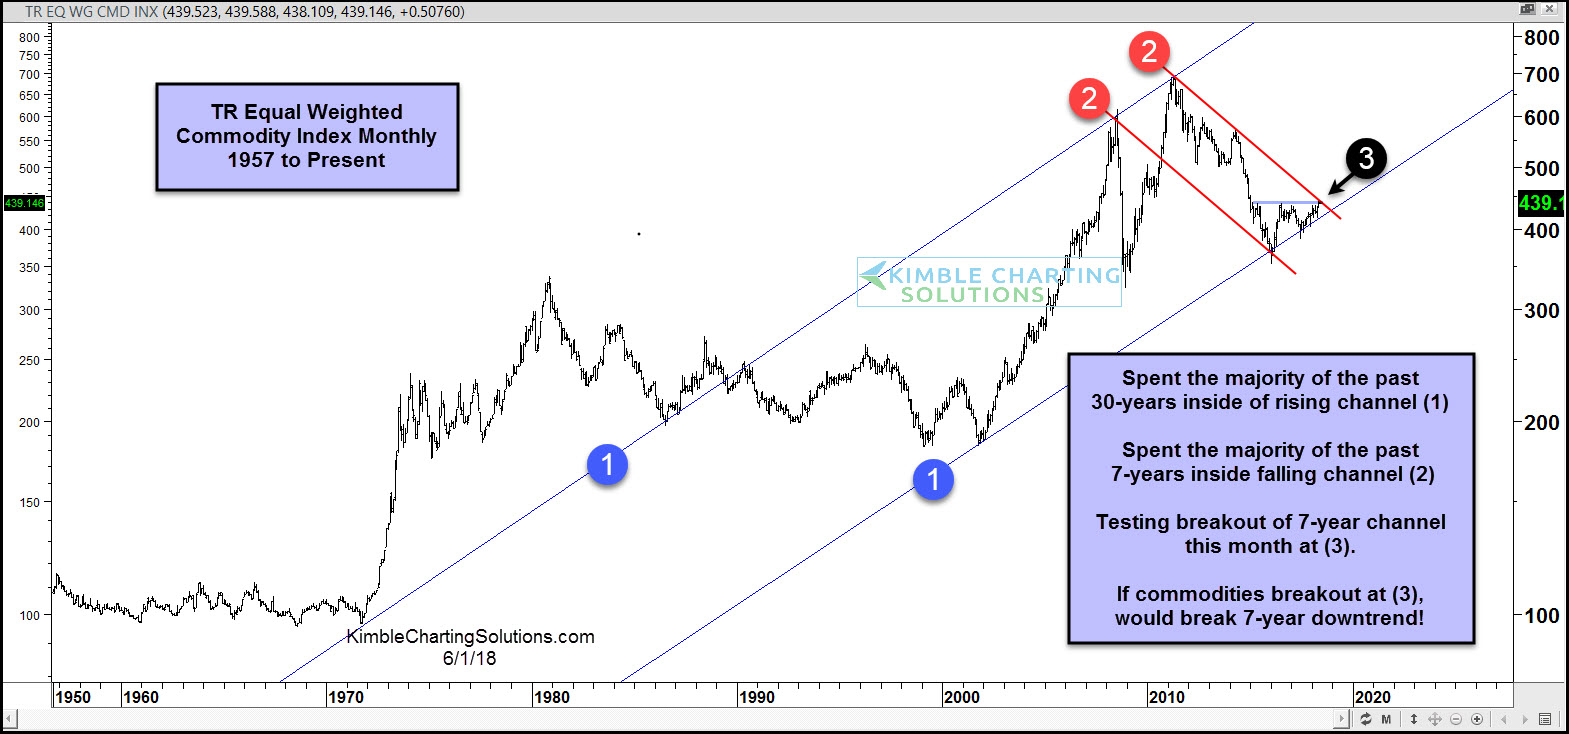
CLICK ON CHART TO ENLARGE
This post was originally written for See It Markets.com. To see original post CLICK HERE.
If Commodities are important to you, check out our Sector/Commodities Sentiment Extremes Report.
–
