
CLICK ON CHART TO ENLARGE
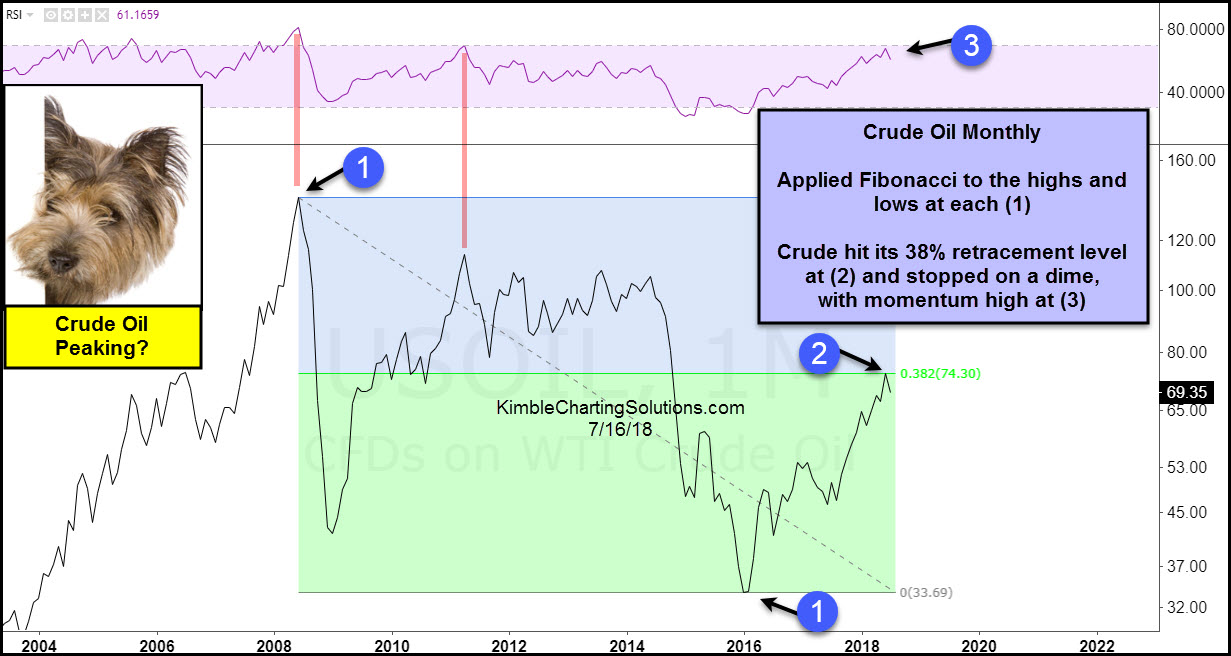
The chart above looks at what could be the most important commodity on the planet, Crude Oil and its price action over the past 15-years.
We applied Fibonacci retracement levels to the highs in 2008 and the lows in 2016, at each (1). The rally off the 2016 lows hit the 38% retracement level last month at (2) where it might have peaked.
While it is hitting this key retracement level, monthly momentum is very high at (3), near the same level where highs took place in 2011.
Crude oil traders have amassed a very crowded trade, similar to trade they had in play at the 2014 highs. They established the wrong trade at prior highs, will it be different this time?
What Crude Oil does at (2), could have a big impact on the overall commodity market, stocks and interest rates, if it would happen to be peaking. Keep a close eye on Crude over the next couple of months, it could be sending a very important macro message!
–
