
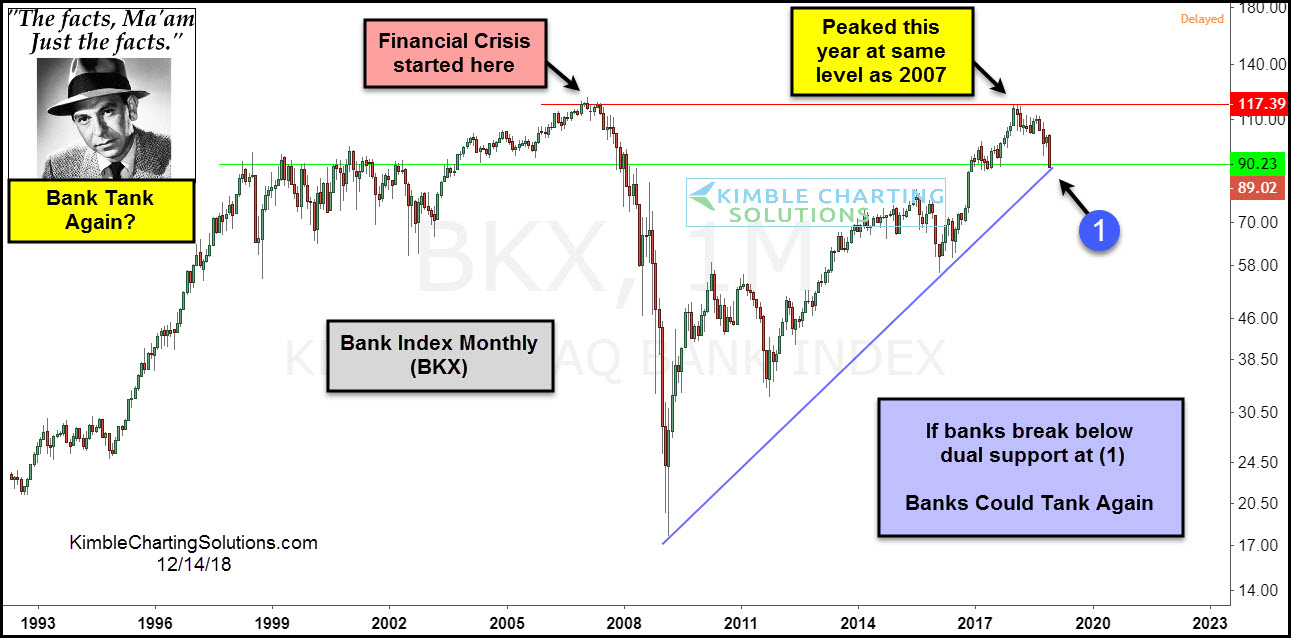
This chart looks at the Bank Index (BKX) over the past 25-years on a monthly basis, reflecting that currently, the 9-year trend in the index remains up.
The index may have created a double top this year, at the same level the financial crisis started unfolding back in 2007.
This index has created a bearish divergence in 2018 when compared to the S&P 500. This divergence has it testing 9-year rising support at (1).
As mentioned earlier, the trend in the banking index remains up and support is support until broken.
Joe Friday Just The Facts Ma’am– If the bank index breaks dual support at (1), they could fall a large percent from current levels. How banks handle support at (1), will send an important message to the broad market and the banking industry.
Below looks at Regional Bank ETF (KRE)-

Similar to the bank index, the trend for KRE remain up at this time. Softness this year has KRE testing dual support at (1).
If BKX and KRE both happen to break support, look for more selling pressure to take place, which would impact the broad market.
Important support tests for the banking industry and the broad market look to be in play friends, as bearish sentiment is very high at this time.
–
