
Long-dated treasury bonds have been crushed over the past year, sending ETFs like TLT (20+ Year US Treasury Bond ETF) spiraling over 20%.
Improving economy? Inflation concerns? Perhaps a combination of both… interest rates have risen sharply and thus bond prices have fallen in historic fashion.
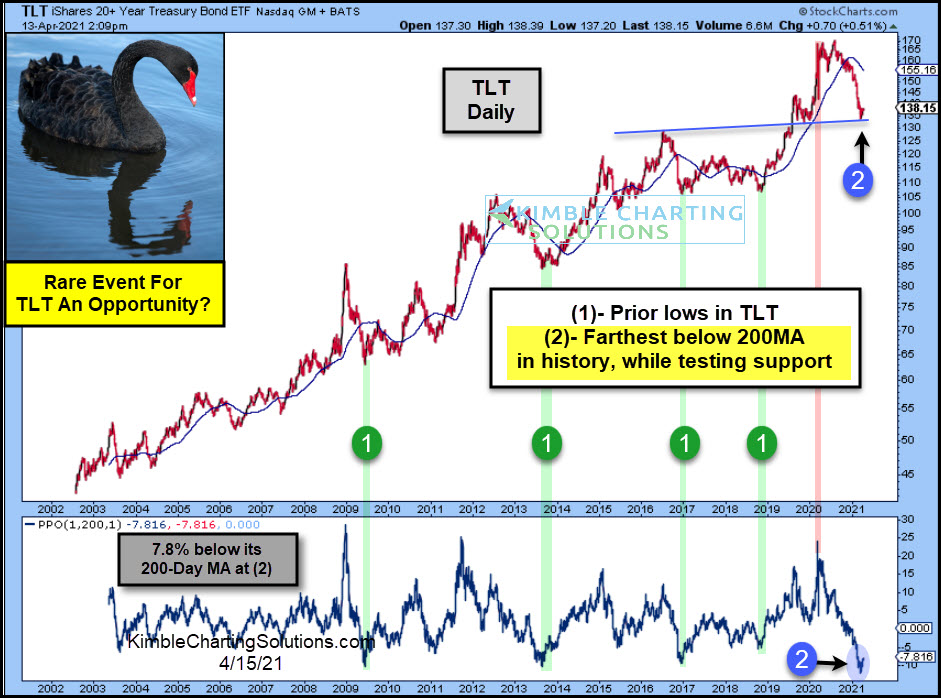
Today’s chart looks at $TLT over the past 20 years. As you can see, the recent decline has truly been historic. $TLT’s price has swung from historically overbought highs to oversold lows.
At present, the long-dated bond ETF ($TLT) is trading 7.8% below its 200-day moving average. This happens to be more oversold than the prior 4 tradable bottoms – marked on the chart by each (1). This historic low comes at the same time that price is testing an important lateral support/resistance area at (2).
Perhaps this rare event will be a buying opportunity for bullish bond traders. Stay tuned!
This article was first written for See It Markets.com. To see the original post CLICK HERE
