
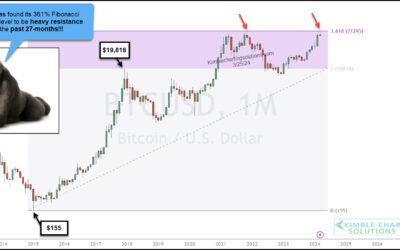
Can Bitcoin Rally Hold Above Key Fibonacci Level?
Bitcoin has struggle to overcome a very important price level for more than two years: the 1.618 Fibonacci extension level. This price area is especially important as it marked Bitcoin’s original all-time high in November 2021. We eclipsed that this month, but price...
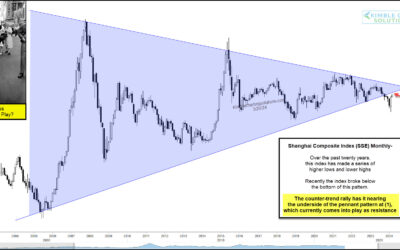
Shanghai Stock Exchange Composite At Long-Term Crossroads!
When the Chinese economy or stock markets are signaling an important turn or good/bad signal, the rest of the world needs to listen. Today, we look at a long-term chart of the important Chinese stock market index, the Shanghai Stock Exchange Composite (SSEC). Could...
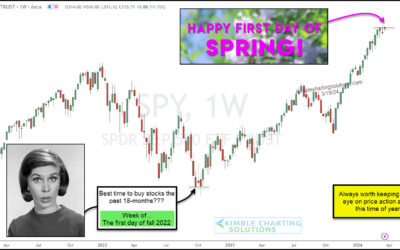
Is S&P 500 Nearing Turning Point With Spring Equinox?
It is always worth keeping a close eye on the stock market price action around this time of year. 18 months ago, it was the first day of fall that seemed to be a great time to buy stocks… and again this last fall. Heck, even spring of 2023 was good. But the broader...
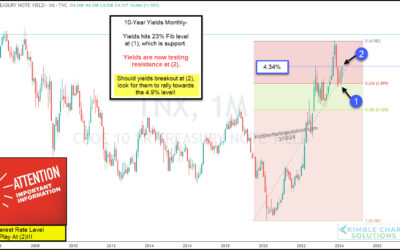
10 Year Bond Yield Testing Key Resistance This Month!
The 10-year treasury bond yield is very closely watched by banks, consumers, and active investors. It is used as a measuring stick for interest rates on loans, bond auctions, etc. When the 10-year treasury bond yield goes higher, so do interest rates on mortgages,...
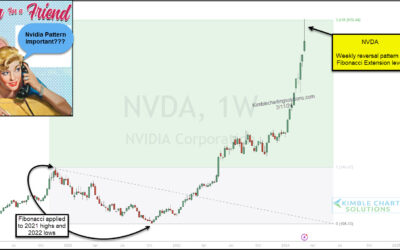
Nvidia Stock Price Reverses Lower From Important Fibonacci Level!
Nvidia’s stock price surged last week, reaching an important Fibonacci extension level (361.8). The rally has been unprecedented. Nvidia (NVDA) is a large cap tech stock and its price has doubled in just 9 weeks! But something happened last week. Nvidia’s formed a...
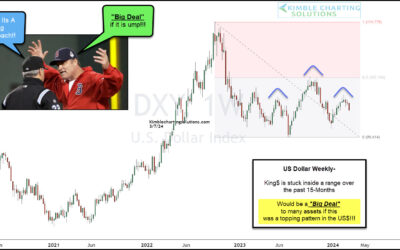
Is the U.S. Dollar Quietly Forming a Bearish Topping Pattern?
The U.S. Dollar continues to be the most powerful currency in the world. And for this reason, it’s also the most watched. When the dollar is on the move, it can have an effect on the various asset classes. Today we look at a “weekly” chart of the old King Dollar. And...
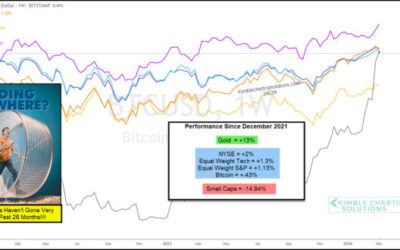
Investor Sentiment Getting Greedy? Seems Unwarranted!
Several indicators of investor sentiment are showing rising “greed” levels. And when investors get greedy, it tends to imply that we are nearing a top. BUT, I am unsure why greed levels are so high when so many assets have little to brag about over the past few years!...
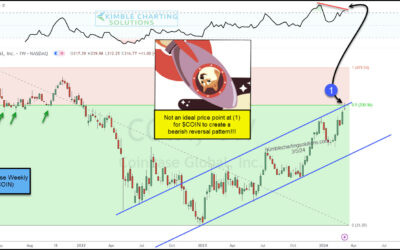
Coinbase (COIN) Stock Price Rally Putting In Bearish Reversal?
The past 15 months have been very good for Coinbase's (COIN) stock price. During that time, COIN has rallied from $31 to over $230. And the rally has seen some wild volatility! Today’s “weekly” chart of Coinbase highlights this and more. As you can see, COIN has been...
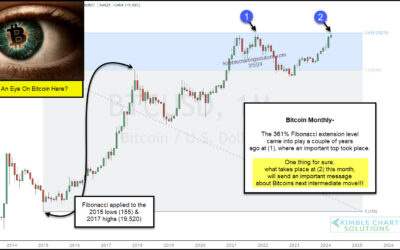
Bitcoin Rally Tests Old High; Will Fibonacci Price Resistance Hold Again?
Bitcoin has been all the rage in the financial markets lately. After it surpassed 50000, headline after headline has come out about it making new all-time highs. Well it finally happened. And Bitcoin’s price has retreated a little since. As you can see on today’s...
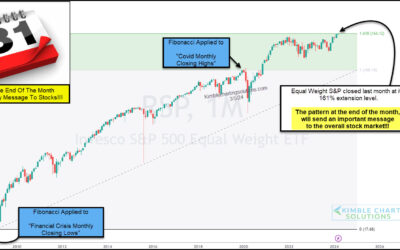
Equal Weight S&P 500 Testing Key Fibonacci Extension Level!
The latest stock market rally has taken several key indices to new highs. One such index is the Equal Weight S&P 500. While this is bullish, today’s long-term “monthly” chart of the Equal Weight S&P 500 ETF (RSP) shows price running into a big Fibonacci...
