by Chris Kimble | Mar 7, 2024 | Kimble Charting
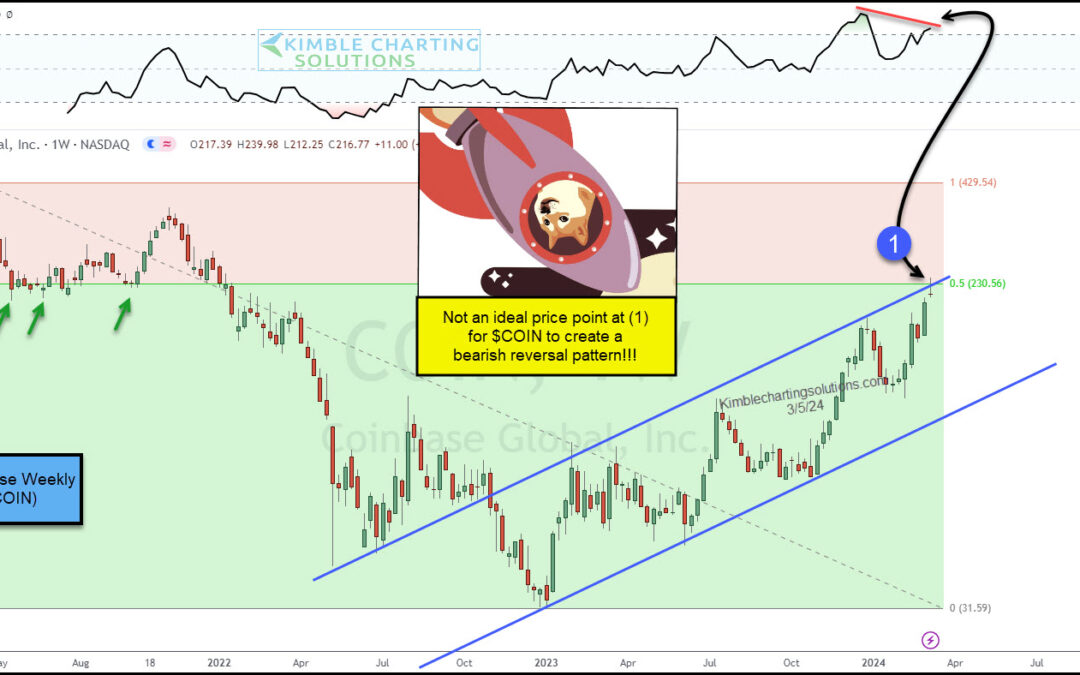
The past 15 months have been very good for Coinbase’s (COIN) stock price. During that time, COIN has rallied from $31 to over $230. And the rally has seen some wild volatility! Today’s “weekly” chart of Coinbase highlights this and more. As you can see, COIN has...
by Chris Kimble | Mar 6, 2024 | Kimble Charting
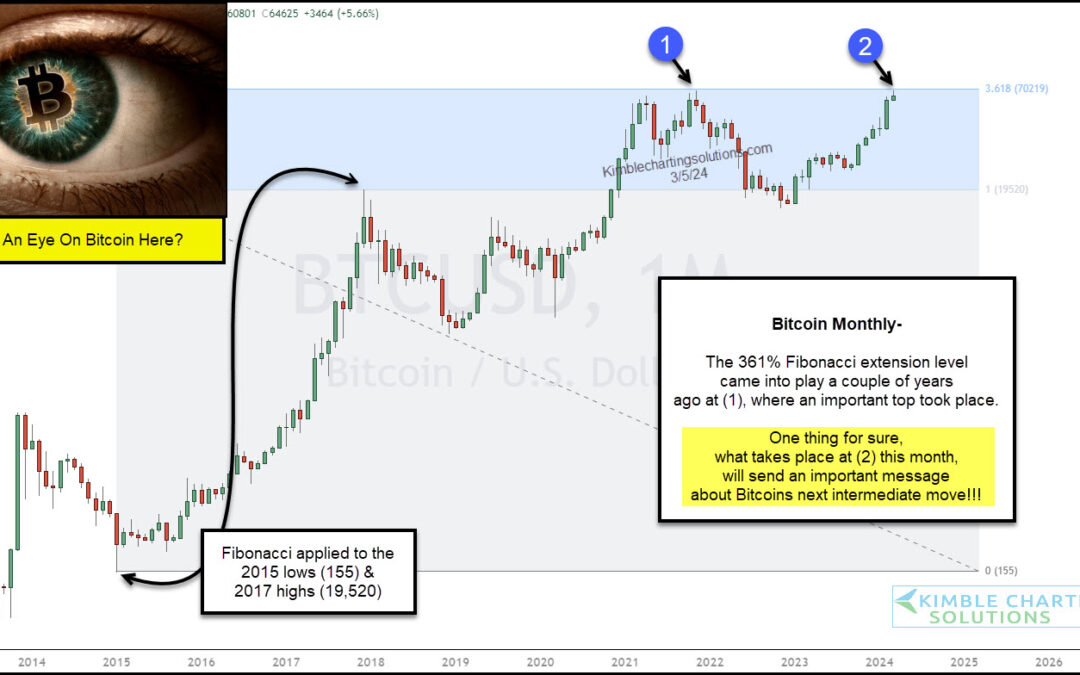
Bitcoin has been all the rage in the financial markets lately. After it surpassed 50000, headline after headline has come out about it making new all-time highs. Well it finally happened. And Bitcoin’s price has retreated a little since. As you can see on today’s...
by Chris Kimble | Mar 6, 2024 | Kimble Charting
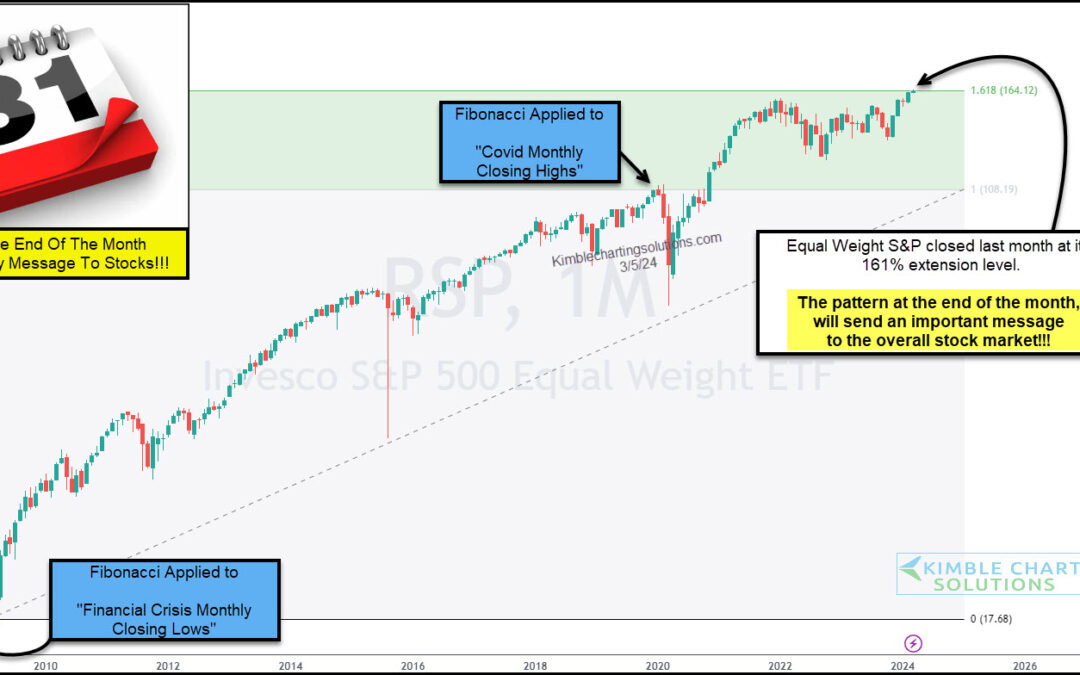
The latest stock market rally has taken several key indices to new highs. One such index is the Equal Weight S&P 500. While this is bullish, today’s long-term “monthly” chart of the Equal Weight S&P 500 ETF (RSP) shows price running into a big Fibonacci...
by Chris Kimble | Mar 5, 2024 | Kimble Charting
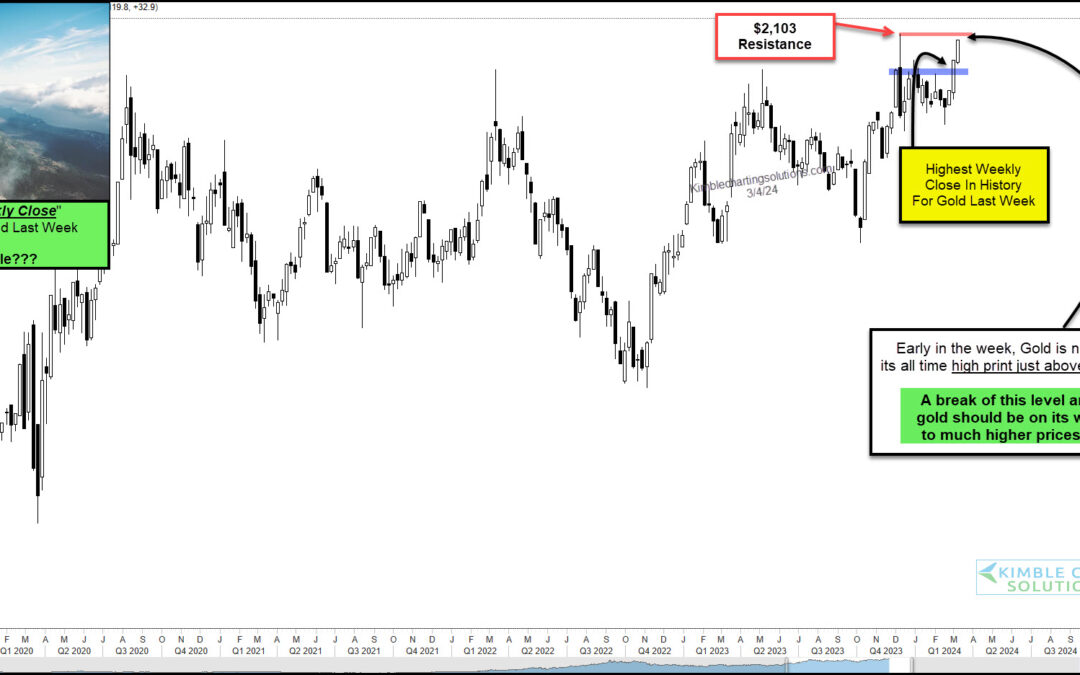
Precious metals may finally be nearing the rally that gold and silver bulls have been waiting for. Today, we simply focus on Gold from a “weekly” price perspective. And let’s just say that the recent price action has been bullish. Last week, Gold closed at its...
by Chris Kimble | Feb 29, 2024 | Kimble Charting
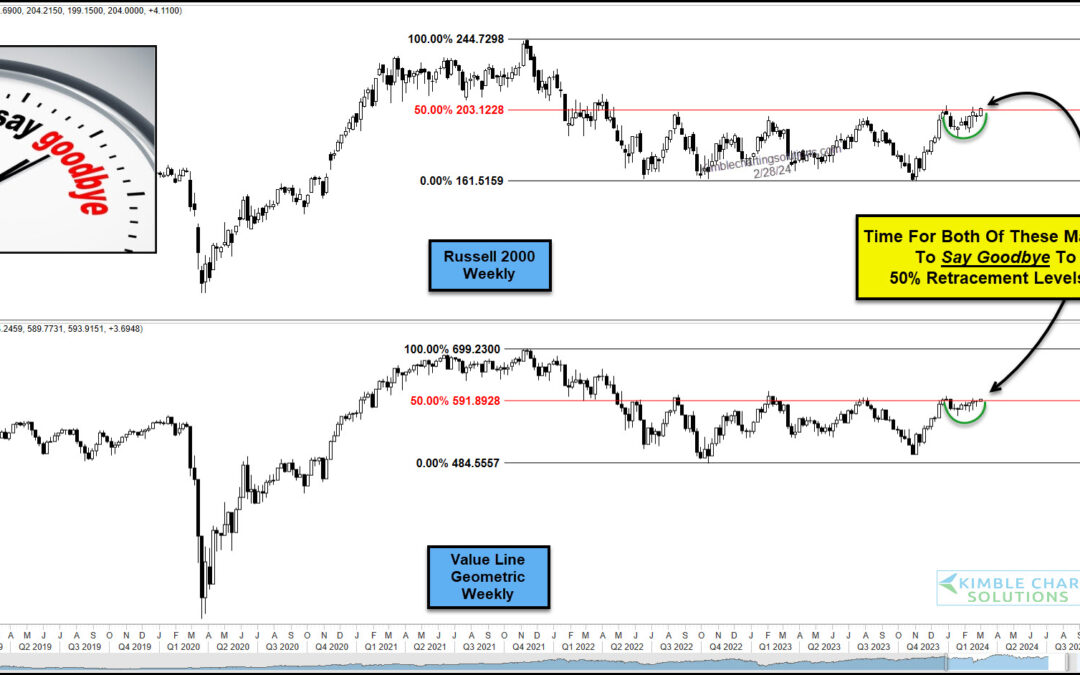
It is fair to say that the stock market has been lead higher by technology stocks and large cap stocks, in general. But two stock market indices that historically have been key to broad market rallies have under-performed: the small cap Russell 2000 Index and the...
by Chris Kimble | Feb 27, 2024 | Kimble Charting
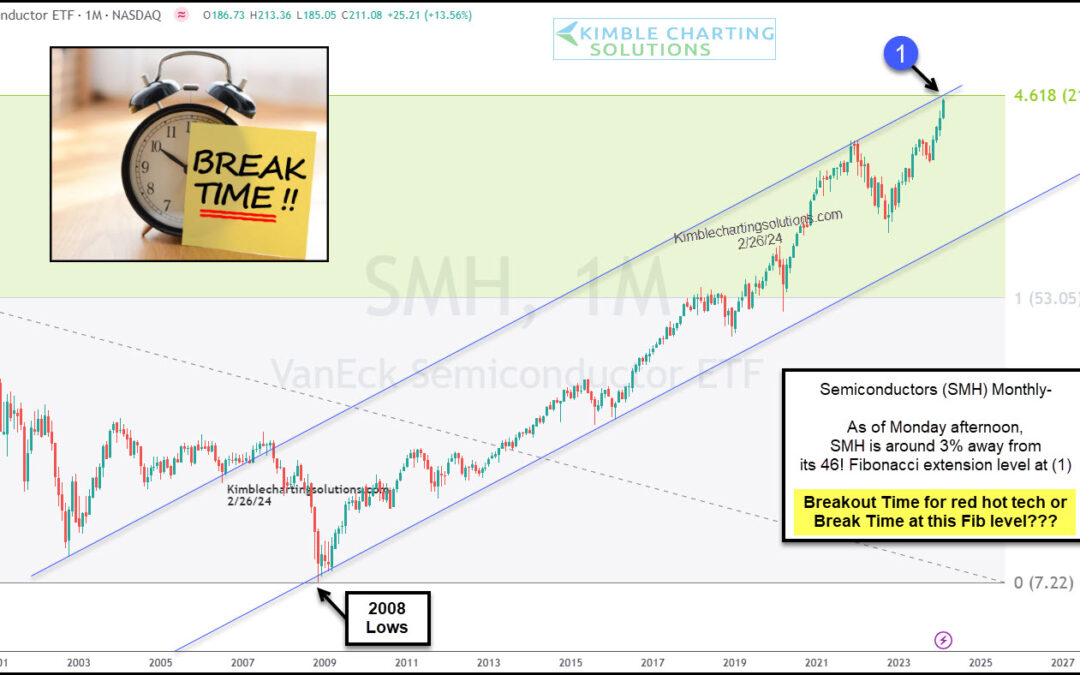
Investors have been treated to one heck of a rally by the Semiconductor Sector (SMH) with stocks like Nvidia (NVDA) leading the sector and stock market higher. But the semiconductor sector may be nearing a crossroads. Is it breakout time or break time for the red-hot...
by Chris Kimble | Feb 21, 2024 | Kimble Charting
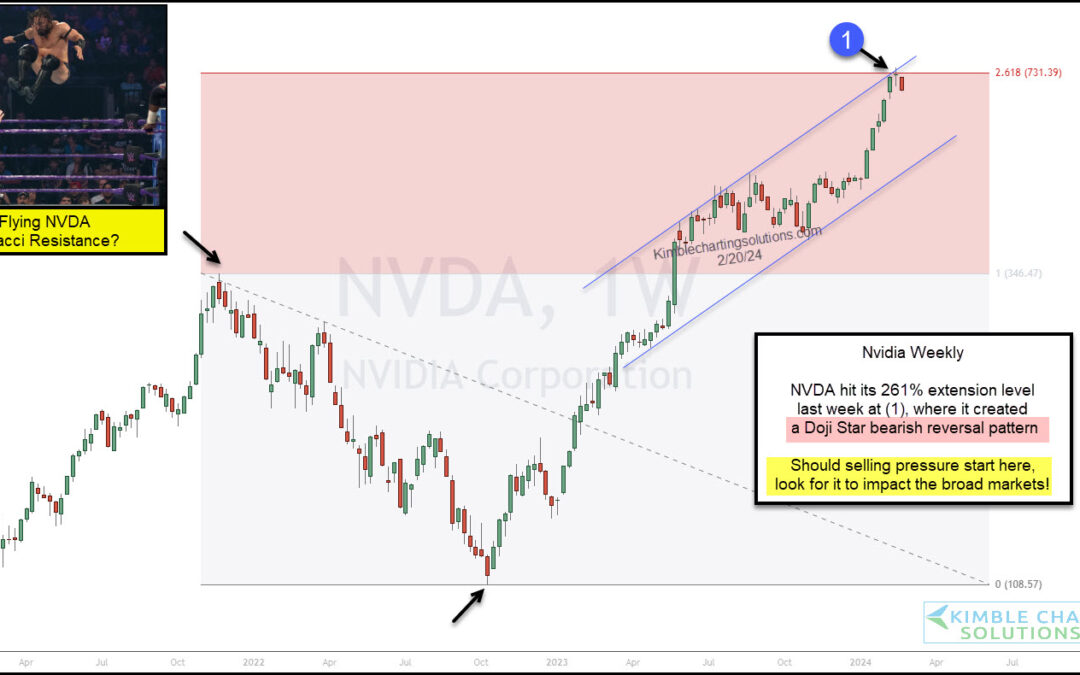
Nvidia has captured the technology investor community by storm. Nvidia’s stock price (ticker: NVDA) has surged in recent weeks and this has lead the broader stock market higher! But, as you can see on today’s “weekly” chart of Nvidia, the high flying NVDA hit its 261%...
by Chris Kimble | Feb 16, 2024 | Kimble Charting
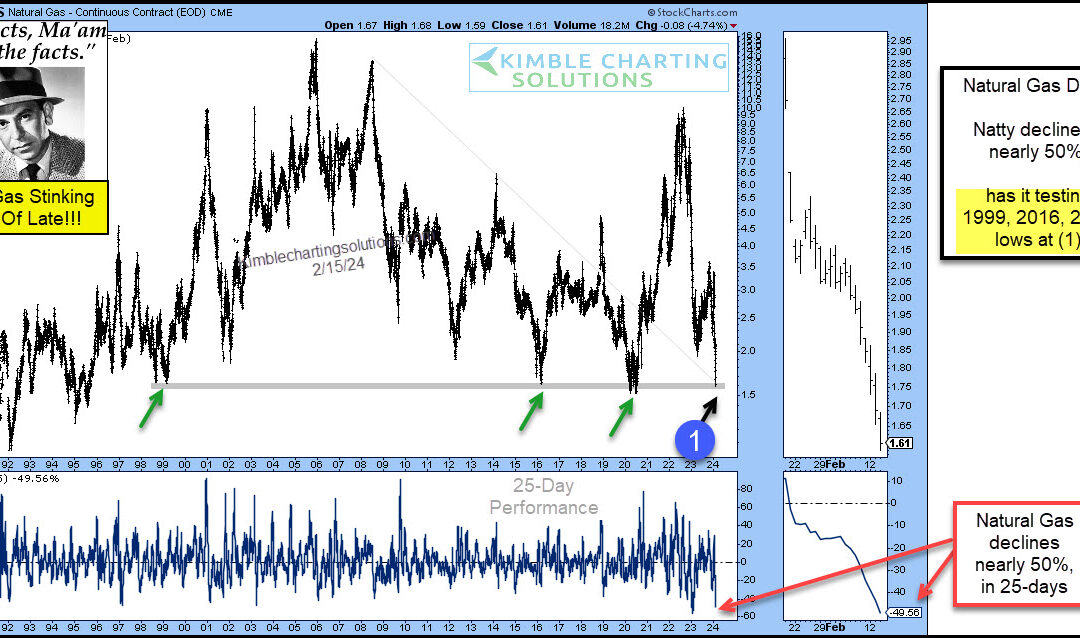
It’s been a rough go for Natural Gas prices. Even with elevated inflation numbers, Natural Gas is still in crash mode. “The facts, Ma’am. Just the facts.” – Joe Friday Today’s Natural Gas chart highlights the crash in Natural Gas prices. Natty has fallen nearly 50...
