
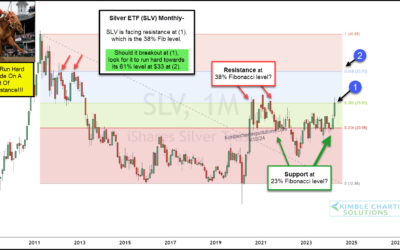
Silver Rally Nears Important Breakout Price Resistance!
The precious metals space continues to show impressive strength in 2024. Gold is at new all time highs and Silver has picked up the pace lately as well, testing its 5 year highs. Over the past few months, we have highlighted several trading setups in Gold and Silver....
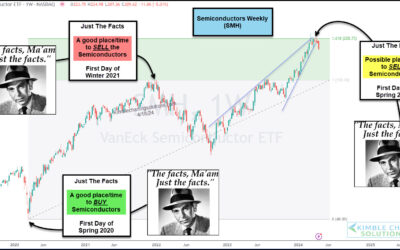
Semiconductors (SMH) Could Be Rolling Over At Key Fibonacci Level, Says Joe Friday
We often talk about leadership. Stocks that are leading the market higher. Sectors that are leading the market higher. Indices that are leading the market higher. Why? Because it pays to be invested in leadership when the market is on the way up. And one can avoid...
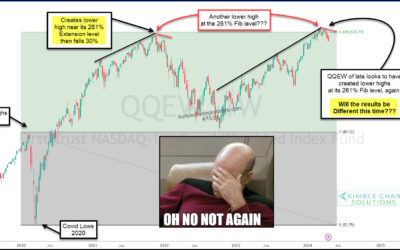
Tech Stocks Struggling At Double Top Fibonacci Resistance!
Technology stocks have been the engine behind the stock market rally into 2024. Even better stated, tech stocks have been a market leader since 2009. So it’s important to keep an eye on the performance of market leadership. And lately the tech-based Nasdaq indices...
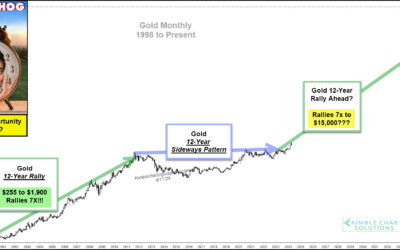
Will Gold’s 12-Year Cycle Send It Much Higher?
Gold spent the better part of the past 12 years trading in a broad sideways pattern. This type of price action tends to drive away speculators (and even some convicted bulls). It also meant gold wasn’t getting many “sexy” headlines as investors weren’t overly bullish....
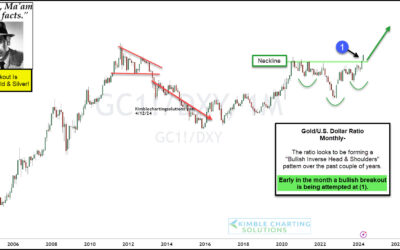
Gold / US Dollar Attempting Historic Bullish Breakout, Says Joe Friday!!!
I have spent a lot of time discussing the bullish implications of Gold price patterns and the recent Gold breakout attempt. So why not offer up yet another example of why Gold (and precious metals partner, Silver) are brimming with bullish possibilities. For...
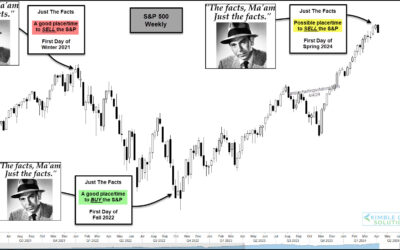
Is the S&P 500 Flashing a Spring Sell Signal?
The stock market has been red hot over the past 5 months or so with both the S&P 500 and Nasdaq sporting big gains. But as we will see in today’s “weekly” chart of the S&P 500 Index, the seasonal start of Winter, Spring, Summer, and Fall can sometimes be a...
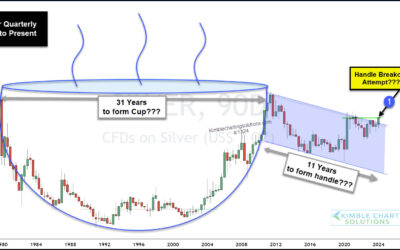
Silver Breakout Adds To Massively Bullish Price Pattern!
I like what I am seeing of late in the precious metals space. Gold has broken out to new highs… and now silver is beginning to show strength. Today we take a look at a long-term “quarterly” chart of Silver, as it seems that something BIG might be brewing. As you can...
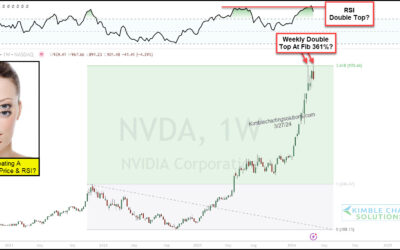
Nvidia’s Stock Reaches Crossroads At Key Fibonacci Price Level
Nvidia has been a lightning rod of attention as it surged to parabolic highs over the past several weeks. This surge also helped lead semiconductors stocks higher, along with the Nasdaq Indices. So what’s next for this high-flier? Above is a “weekly” chart of Nvidia...
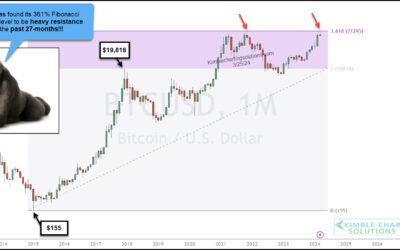
Can Bitcoin Rally Hold Above Key Fibonacci Level?
Bitcoin has struggle to overcome a very important price level for more than two years: the 1.618 Fibonacci extension level. This price area is especially important as it marked Bitcoin’s original all-time high in November 2021. We eclipsed that this month, but price...
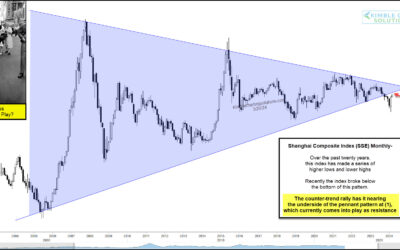
Shanghai Stock Exchange Composite At Long-Term Crossroads!
When the Chinese economy or stock markets are signaling an important turn or good/bad signal, the rest of the world needs to listen. Today, we look at a long-term chart of the important Chinese stock market index, the Shanghai Stock Exchange Composite (SSEC). Could...
