
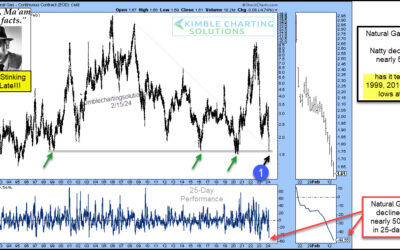
Natural Gas Crashes Into Historic 25-Year Price Support, Says Joe Friday!
It’s been a rough go for Natural Gas prices. Even with elevated inflation numbers, Natural Gas is still in crash mode. “The facts, Ma’am. Just the facts.” – Joe Friday Today’s Natural Gas chart highlights the crash in Natural Gas prices. Natty has fallen nearly 50...
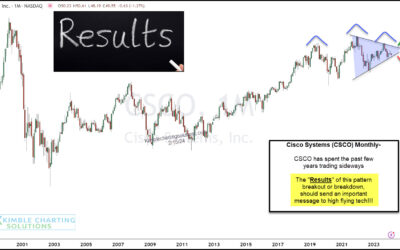
Is Cisco (CSCO) About To Lose Leadership Position?
Cisco (CSCO) used to be one of the four horsemen of the Nasdaq (tech stocks) rally. While CSCO still has plenty of influence as a large-cap leader in the Semiconductor Sector, it is under-performing its peers and trading in a pennant pattern. In short, Cisco has...
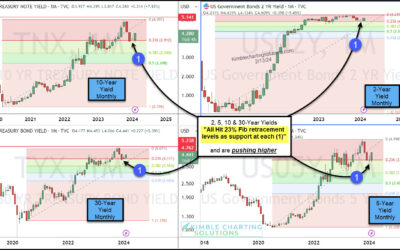
Treasury Bond Yields Reverse Higher Off Key Fibonacci Level!
The past few months have given investors the feeling that the 3 year (monster) rally in treasury bond yields is over. But the lull may be over. And it’s looking like bond yields (interest rates) may be rallying again. Why? Well today’s chart 4-pack looks at treasury...
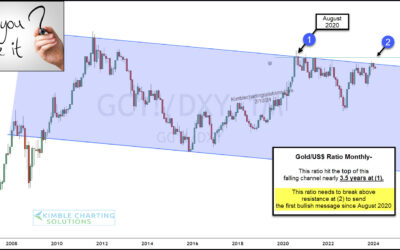
Bullish Message For Gold Investors… Only If This Ratio Breaks Out!
Gold prices remain elevated but have yet to record the major breakout that gold bulls are looking for. Today, we revisit an important Gold ratio that we have been following for months: the Gold to U.S. Dollar ratio. And above, you can see why. The long-term “monthly”...
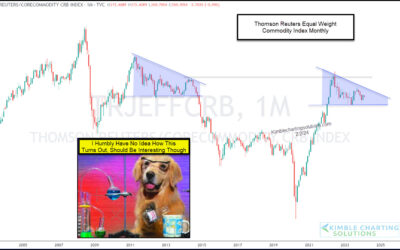
Commodities Wedge Pattern Should Lead To Huge Move!
During the COVID pandemic, commodity prices soared. And this lead to a bout of inflation that we hadn’t seen in years. But commodity prices have leveled off and this has helped to keep inflation in check. This consolidation like pattern can be see on today’s “monthly”...
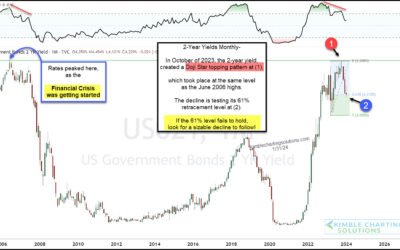
2-Year Treasury Bond Yields Near Important Fibonacci Support!
The Federal Reserve has paused its interest rate hikes and inflation data seems to be leveling off. We’ll see. All in all, bond yields (interest rates) are pulling back and investors are hopeful that we have a soft landing. Looking at today’s long-term “monthly” chart...
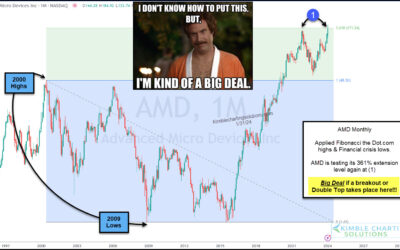
Advanced Micro Devices (AMD) Attempting HUGE Fibonacci Breakout!
Semiconductor stocks have been leading technology stocks higher. And today’s Semi stock has been red hot: Advanced Micro Devices (AMD) As you can see on the “monthly” chart below, AMD has been ripping higher in recent months. But it’s important to note the shaded...
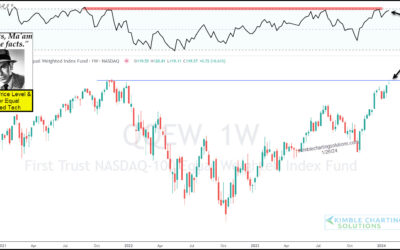
Tech Stocks Reach Important Price Resistance Level, Says Joe Friday!
The end of year rally has trickled over into 2024 and it has been lead by tech stocks. But has the rally gotten long in the tooth? “The facts, Ma’am. Just the Facts.” – Joe Friday Today’s “weekly” chart of the Nasdaq 100 Equal Weight Fund (QQEW) highlights an...
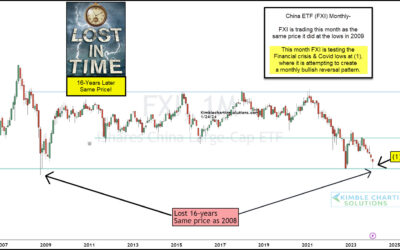
China ETF (FXI) Attempting Triple Bottom This Month!
It’s been over 15 years since China’s equity market was in a long-term bullish position. Now, don’t get me wrong- there have been plenty of medium-term trends to trade and make money, but the long-term chart for the major China ETF (FXI) has traded sideways since the...
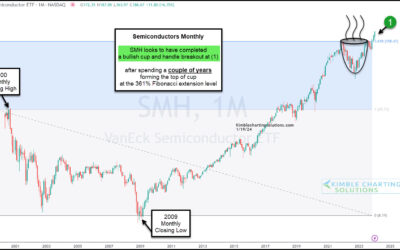
Semiconductors (SMH) Trigger Buy Signal With Cup and Handle Breakout!
Not too long ago, we wrote about a potential cup with handle breakout for the market-leading Semiconductors ETF (SMH). You can read that here. Today, we examine a “monthly” chart of $SMH to provide an update on that powerful price pattern. As you can see, a breakout...
