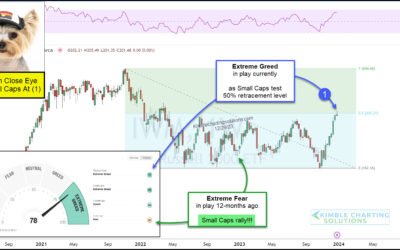
Are Small Cap Investors Getting Greedy At Important Resistance?
Small-caps stocks have been a noticeable laggard for over two years. But a recent year-end rally has set the Russell 2000 (IWM) on fire. Will this mark a change in performance in the future? Today’s chart of the Russell 2000 ETF (IWM) highlights its underperformance...
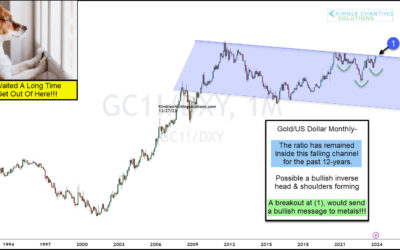
Gold Indicator Testing Important Bullish Breakout Level!
Precious Metals have been strong this month and have metal heads excited for next year. One gauge that I use to highlight the strength of Gold is the ratio of the price of an ounce of Gold to the US Dollar Index. And today’s chart shows why we could be at a critical...
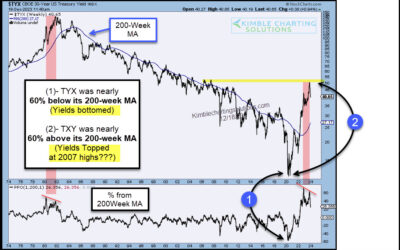
Are Bond Yields Facing Historic Overbought Correction?
The past few years have seen interest rates soar. But perhaps it’s a case of too far, too fast. Today we look at interest rates in the form of treasury bond yields. And more specifically, the 30-year treasury bond yield. As you can see, the 30-year bond yield has been...
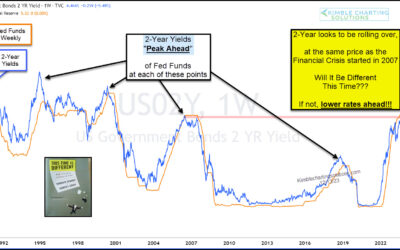
Falling Interest Rates Is Historically Bullish For Precious Metals!
Investors are getting excited about the Federal Reserve’s interest rate pause and a soft landing for the economy. Time will tell, but I do want to share with you a correlation that may be telling for the future of interest rates… and perhaps precious metals. Today we...
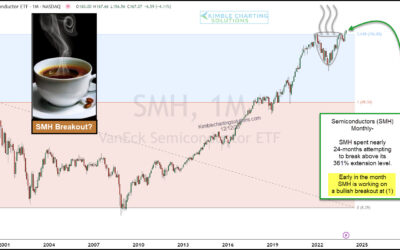
Semiconductors (SMH) Attempting Bullish Cup and Handle Breakout!
As I often point out, technology stocks have been the leader of bull market since 2009. And it’s always a good idea to keep a good eye on leadership. Within the technology sector, the Semiconductors are an area that is often out-performing. Today, we highlight why...
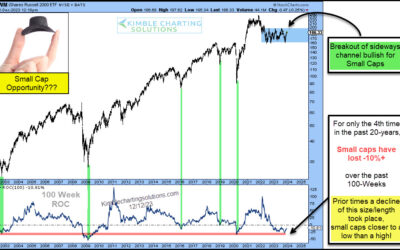
Rare Oversold Signal Could Send Russell 2000 Much Higher!
It is no secret that small-cap stocks have been out of favor. And underperforming! BUT lately, small-cap stocks have been in rally mode. So is there any reason for the recent buying? And could this continue? Today we look at a “weekly” chart of the Russell 2000 ETF...
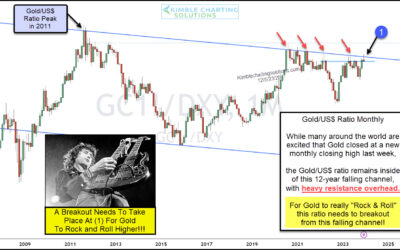
Is the Gold/U.S. Dollar Ratio Setting Up For A Major Breakout?
Precious metals prices have been creeping higher with Gold trading over $2000/oz. A weaker US Dollar has provided a nice tailwind and Gold bugs celebrated a new monthly closing high last week… So, is it time for Gold to finally break out to new all-time highs? Well,...
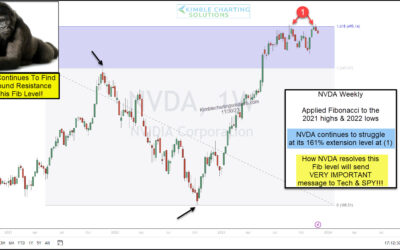
Market Leader Nvidia (NVDA) Struggling At Key Fibonacci Resistance!
Technology stocks have lead the market higher for nearly 2 decades. Semiconductors have been a big part of that leadership. And the leader of all leaders, Nvidia (NVDA), has helped the Nasdaq soar over the past year. But its leadership has come into question of late…...
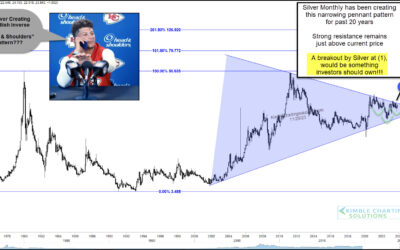
Silver Bullish Head & Shoulders Near Breakout Level!
Precious metals prices have quietly crept higher in recent weeks. And if the rally keeps going, Silver could trigger a very bullish buy signal. Today, we look at a long-term “monthly” chart of Silver. And, as you can see, Silver has formed a gigantic pennant pattern...
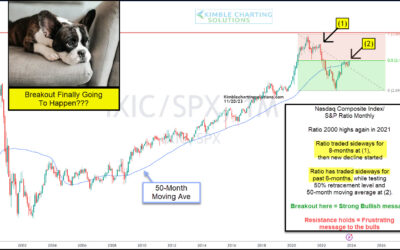
Are Technology Stocks Ready To Lead the Next Bull Market?
The main engine of the domestic economy and stock market indices is the technology sector. No doubt about it. Technology stocks have lead the stock market for over two decades, so it’s always worth watching the Nasdaq indices and how they are faring. Today we provide...

