by Chris Kimble | Apr 5, 2024 | Kimble Charting
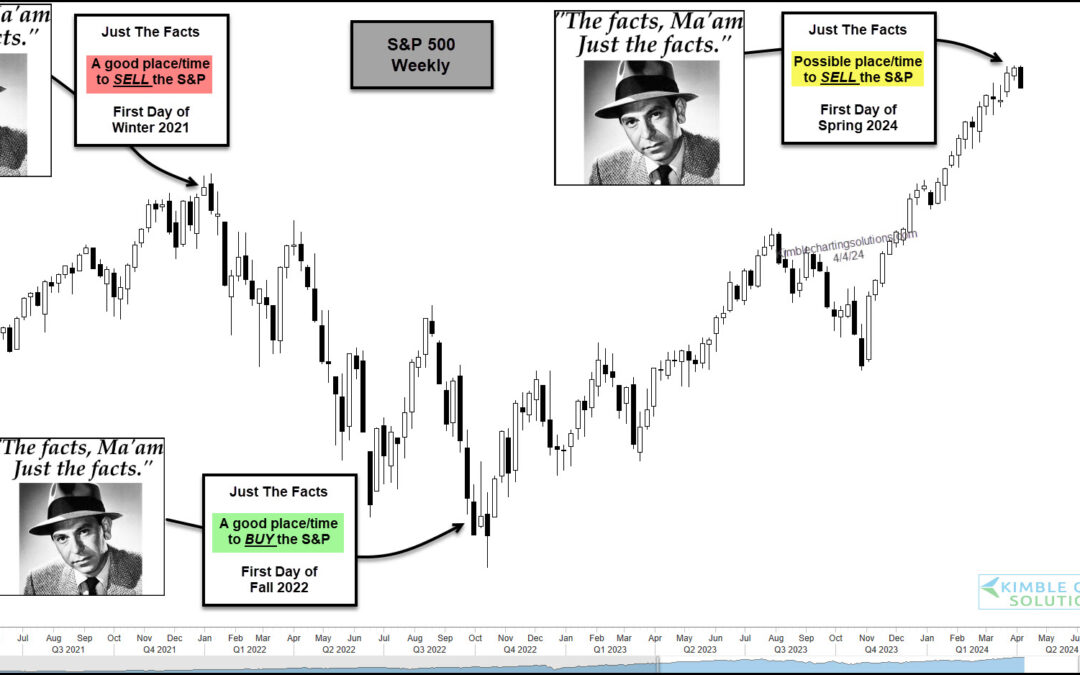
The stock market has been red hot over the past 5 months or so with both the S&P 500 and Nasdaq sporting big gains. But as we will see in today’s “weekly” chart of the S&P 500 Index, the seasonal start of Winter, Spring, Summer, and Fall can sometimes be a...
by Chris Kimble | Apr 4, 2024 | Kimble Charting
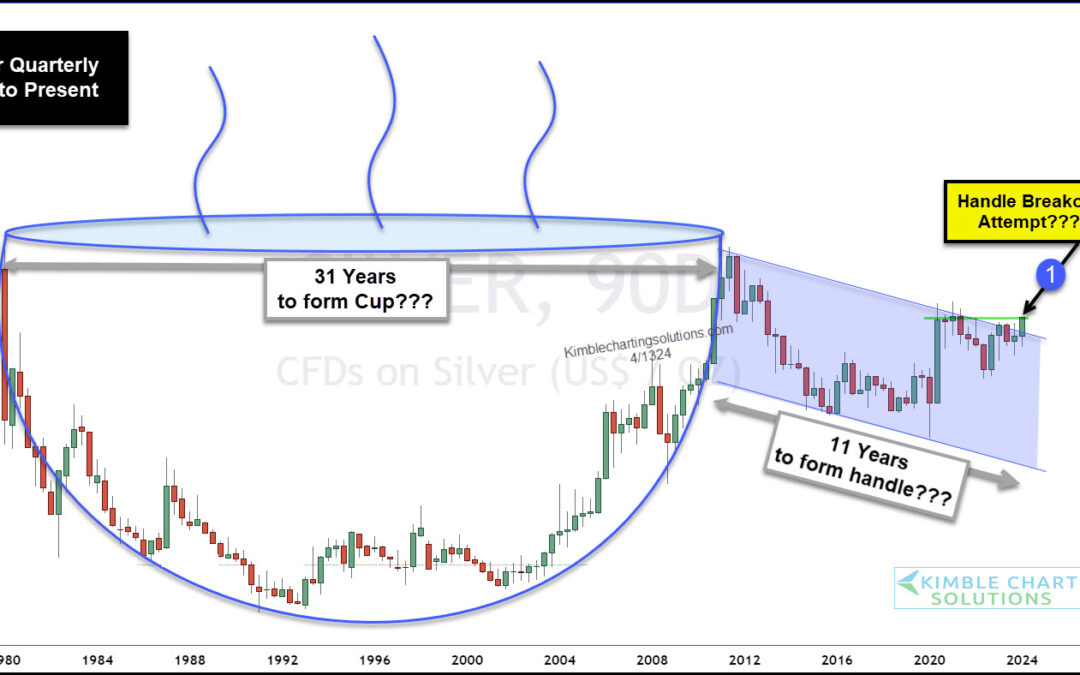
I like what I am seeing of late in the precious metals space. Gold has broken out to new highs… and now silver is beginning to show strength. Today we take a look at a long-term “quarterly” chart of Silver, as it seems that something BIG might be brewing. As you can...
by Chris Kimble | Mar 27, 2024 | Kimble Charting
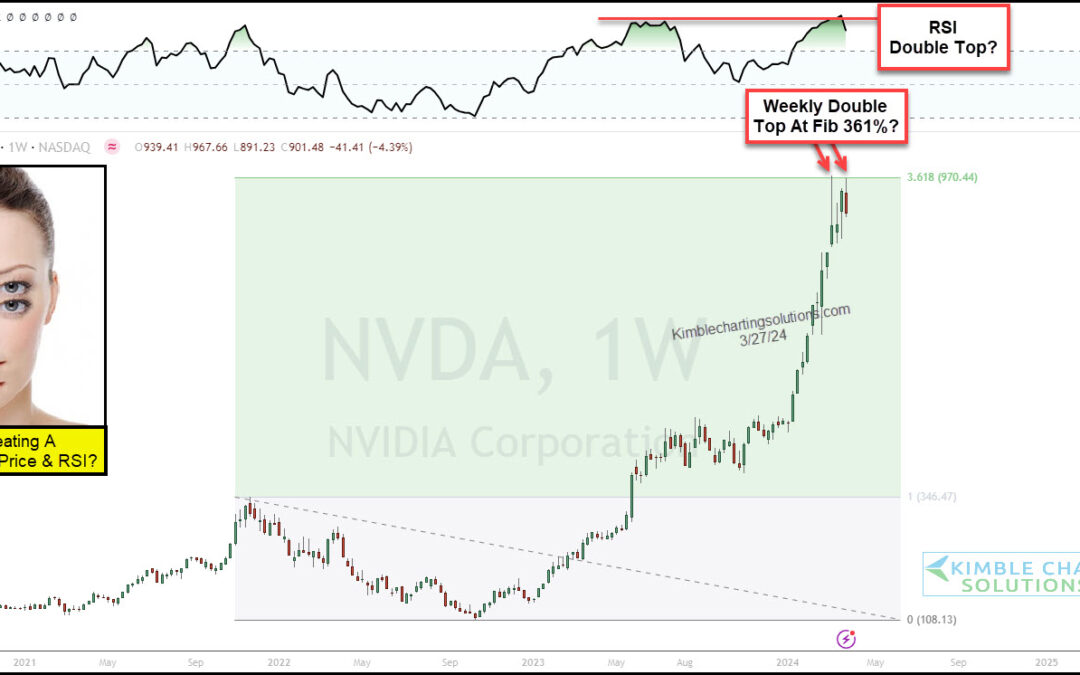
Nvidia has been a lightning rod of attention as it surged to parabolic highs over the past several weeks. This surge also helped lead semiconductors stocks higher, along with the Nasdaq Indices. So what’s next for this high-flier? Above is a “weekly” chart of Nvidia...
by Chris Kimble | Mar 26, 2024 | Kimble Charting
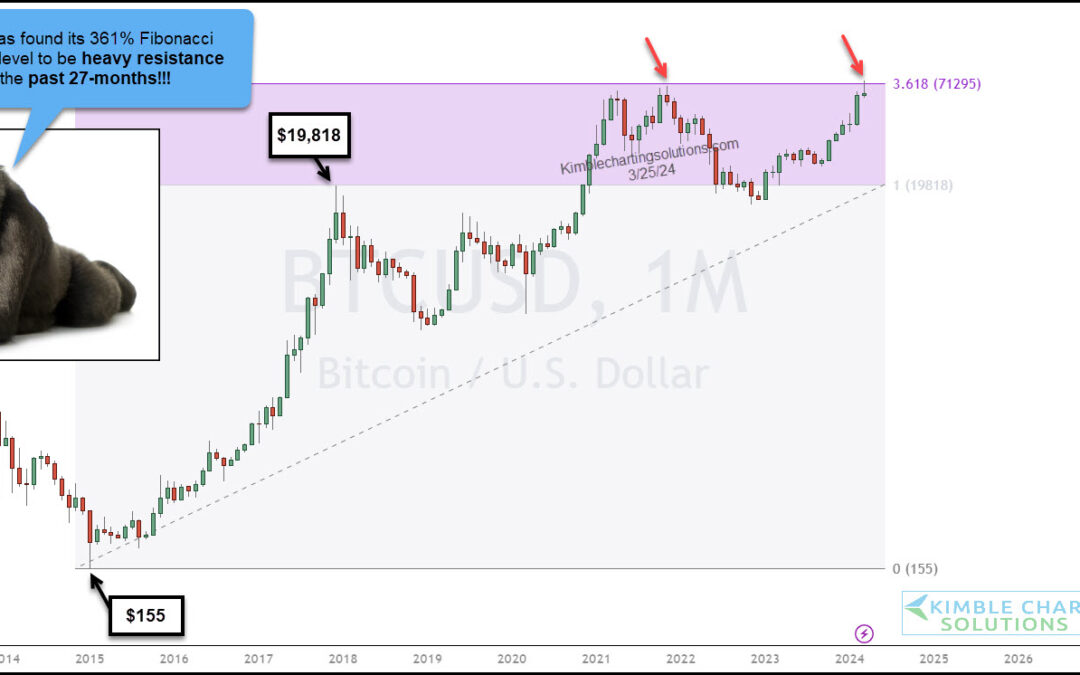
Bitcoin has struggle to overcome a very important price level for more than two years: the 1.618 Fibonacci extension level. This price area is especially important as it marked Bitcoin’s original all-time high in November 2021. We eclipsed that this month, but price...
by Chris Kimble | Mar 22, 2024 | Kimble Charting
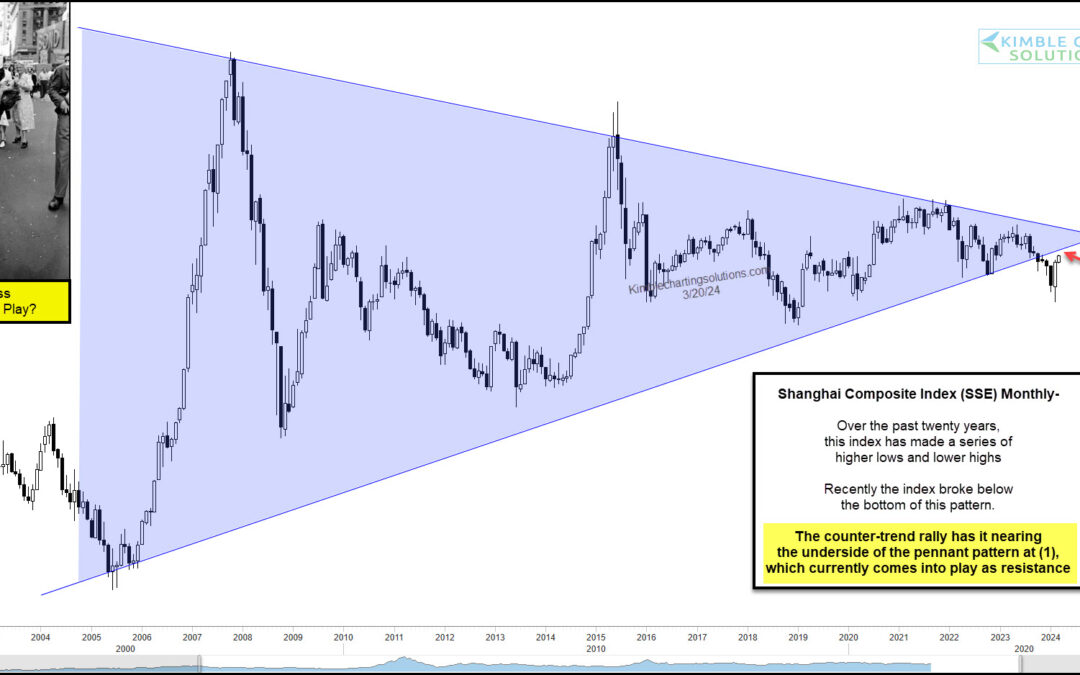
When the Chinese economy or stock markets are signaling an important turn or good/bad signal, the rest of the world needs to listen. Today, we look at a long-term chart of the important Chinese stock market index, the Shanghai Stock Exchange Composite (SSEC). Could...
by Chris Kimble | Mar 20, 2024 | Kimble Charting
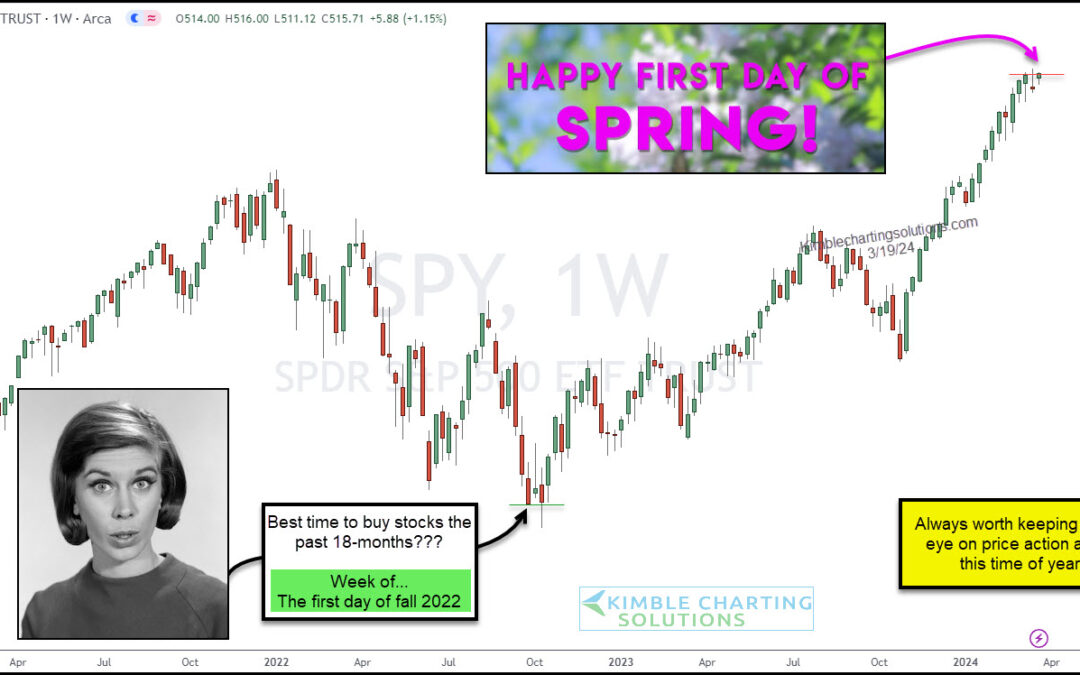
It is always worth keeping a close eye on the stock market price action around this time of year. 18 months ago, it was the first day of fall that seemed to be a great time to buy stocks… and again this last fall. Heck, even spring of 2023 was good. But the broader...
by Chris Kimble | Mar 19, 2024 | Kimble Charting
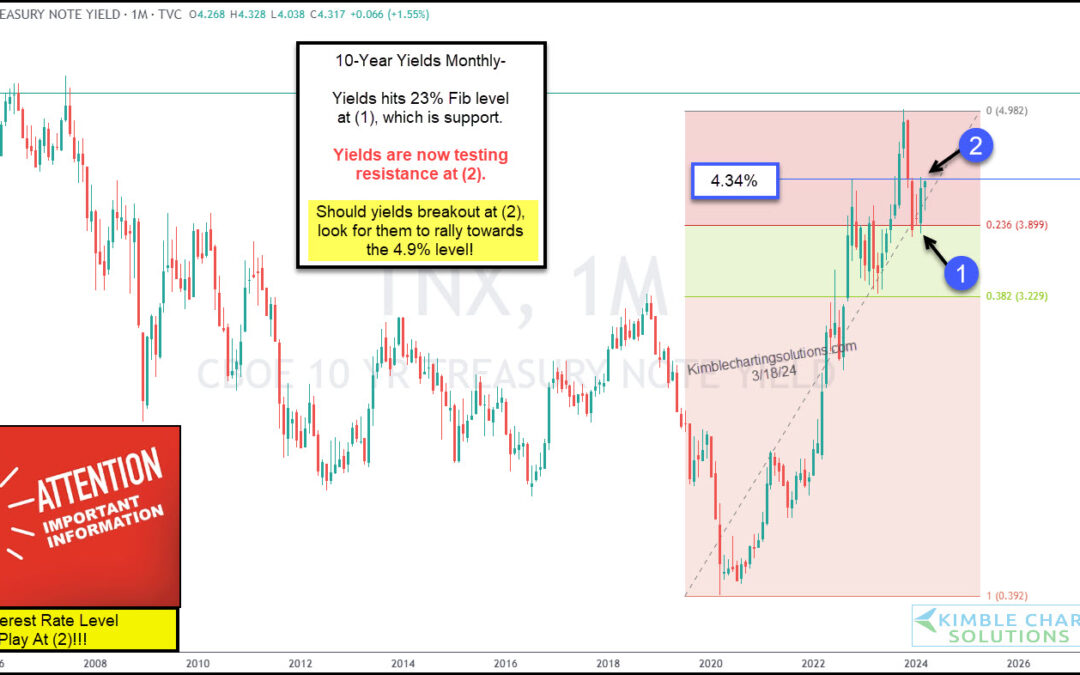
The 10-year treasury bond yield is very closely watched by banks, consumers, and active investors. It is used as a measuring stick for interest rates on loans, bond auctions, etc. When the 10-year treasury bond yield goes higher, so do interest rates on mortgages,...
by Chris Kimble | Mar 13, 2024 | Kimble Charting
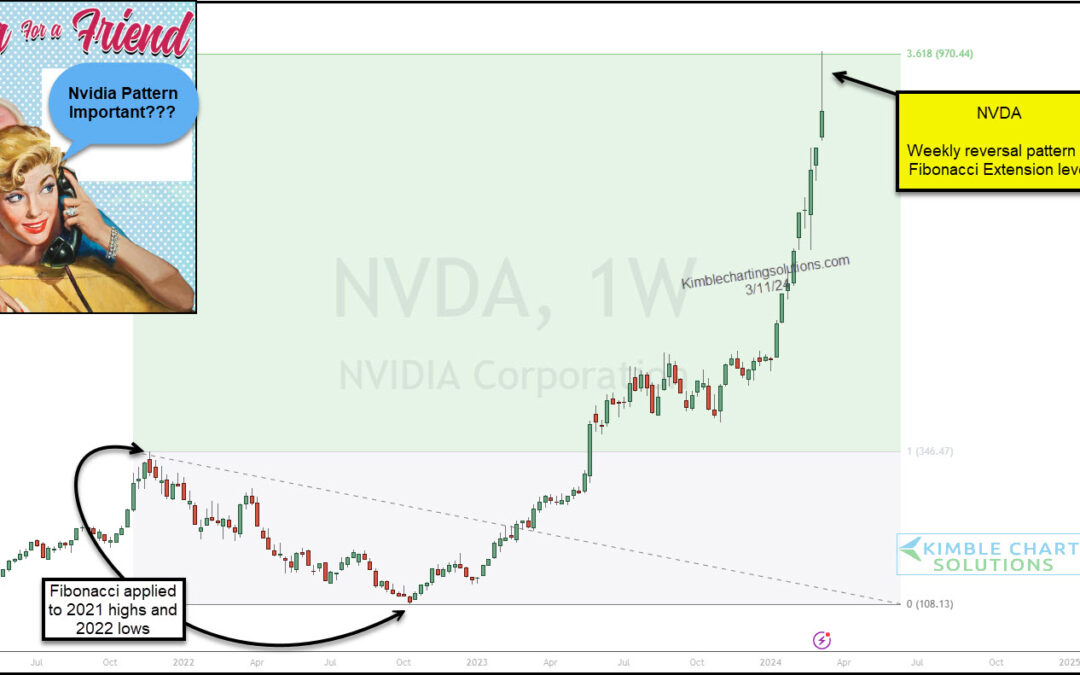
Nvidia’s stock price surged last week, reaching an important Fibonacci extension level (361.8). The rally has been unprecedented. Nvidia (NVDA) is a large cap tech stock and its price has doubled in just 9 weeks! But something happened last week. Nvidia’s formed a...
