
by Chris Kimble | Sep 3, 2013 | Kimble Charting, Sector / Commodity
CLICK ON CHART TO ENLARGE Natural Gas ETF (UNG) fell 30% from it April highs to its early August lows, as it hit the bottom of of the falling channel above. Now UNG is breaking above resistance of the falling channel above. Since August the 7th, the inset chart...
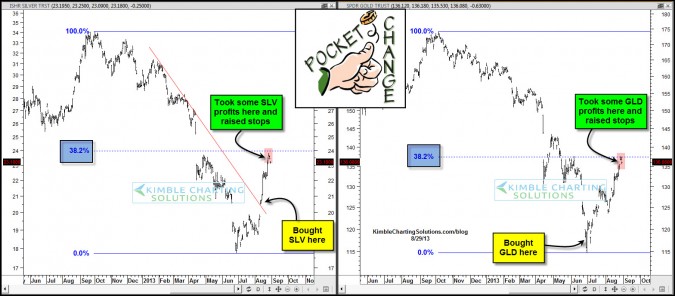
by Chris Kimble | Aug 29, 2013 | Kimble Charting, Sector / Commodity
CLICK ON CHART TO ENLARGE Metals, Sector/Commodity Sentiment Extremes & Premium members added a little “Pocket Change” to their portfolio’s as they took gains in GLD & SLV earlier this week. Why take gains and add a little Pocket Change? Both...

by Chris Kimble | Jul 2, 2013 | Kimble Charting, Sector / Commodity
CLICK ON CHART TO ENLARGE The Power of the Pattern shared with Sector/Commodity Sentiment Extreme members last week that Active Money Managers were pairing back risk asset exposure quite a bit of late. This decline is reflecting a decent shift in sentiment among the...

by Chris Kimble | Mar 26, 2013 | Global Dashboard, Kimble Charting, Sector / Commodity
CLICK ON CHART TO ENLARGE Even though the Dow stands at all-time highs and the S&P 500 is within a few percent of its all-time highs, the S&P 100 remains 17% below its highs reached 13 years ago. Does it have to do with a 26-year resistance line? I doubt...
