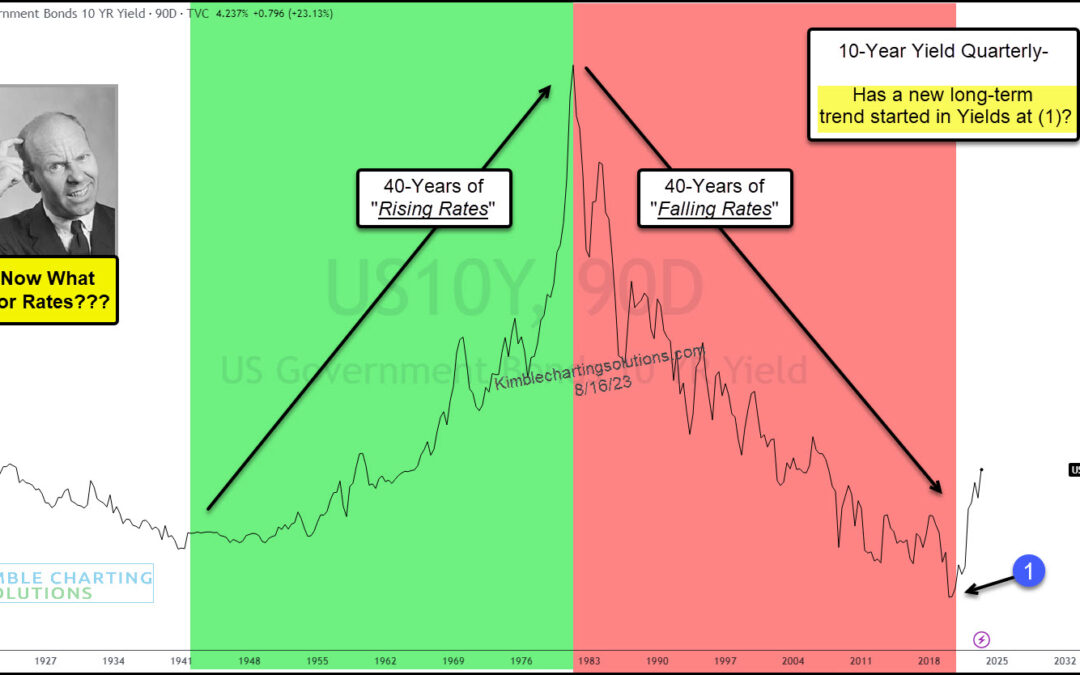
by Chris Kimble | Aug 21, 2023 | Kimble Charting
Rising interest rates are beginning to spook investors. And rightfully so. It’s been the fastest rise in rates in decades. And just when we thought interest rates were easing, they pushed higher once more! 40 years up and then 40 years down… now what for bond yields?...
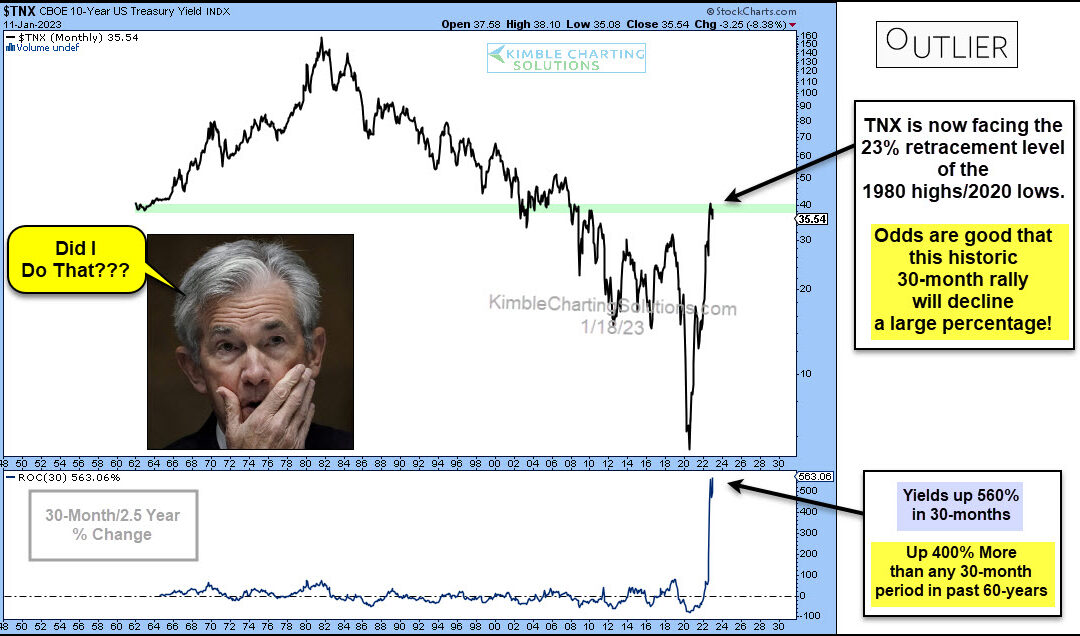
by Chris Kimble | Jan 19, 2023 | Kimble Charting
Interest rates have risen rather quickly as the Federal Reserve attempts to fight inflation. Will the move be a case of too far, too fast? Today’s long-term “monthly” chart of the 10-year US treasury bond yield seems to think so. In my humble opinion, the chart below...
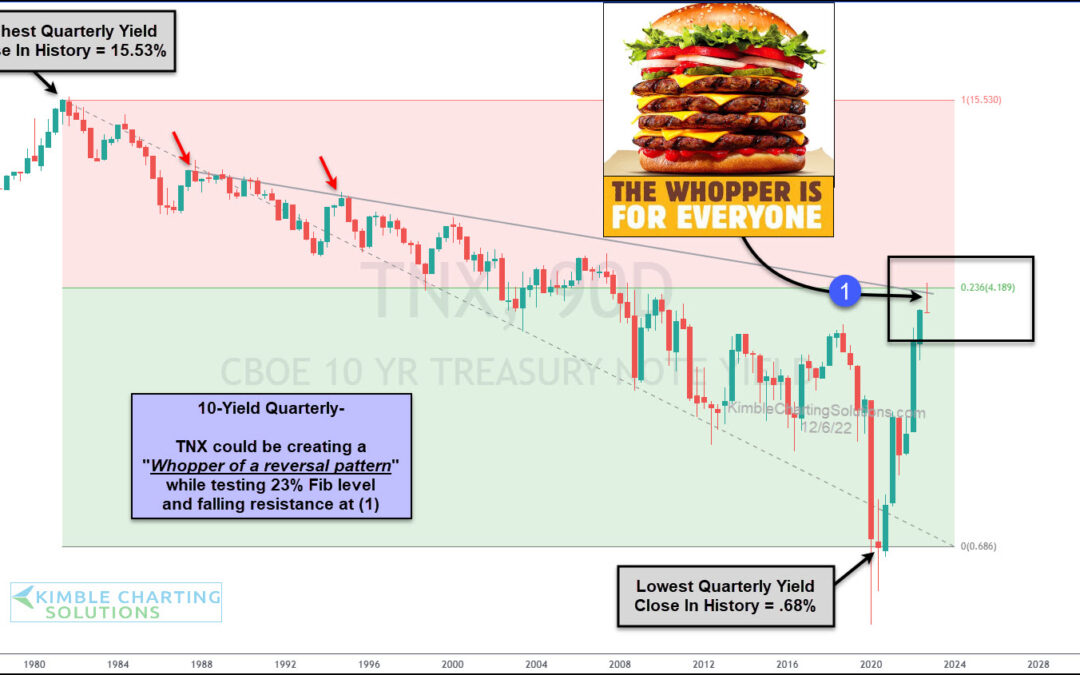
by Chris Kimble | Dec 7, 2022 | Kimble Charting
The past few years have seen extreme volatility in the bond market, which equates to similar volatility in interest rates. And it all started with the onset of coronavirus. The initial panic decline in bond yields (interest rates) was followed by a surge that lasted...
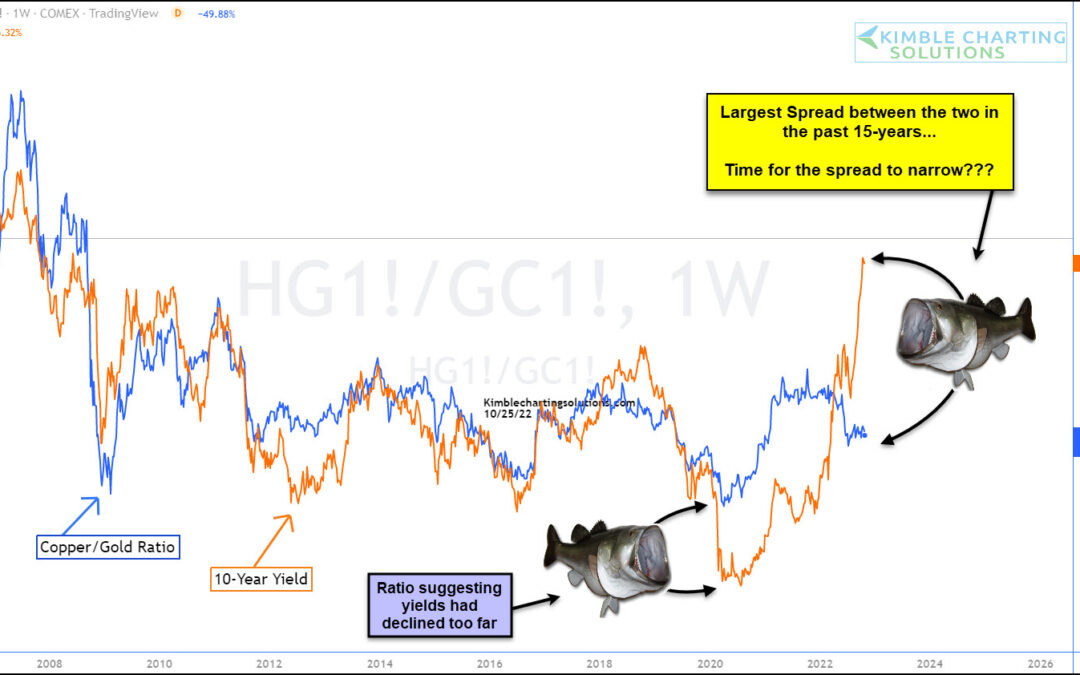
by Chris Kimble | Oct 26, 2022 | Kimble Charting
The price of copper to gold has been a correlation that has followed 10-Year US Treasury bond yields (in trend) fairly closely. This correlation has been one that I’ve followed to see if bond yields are changing trend, or if the trend has become overdone. Today, this...
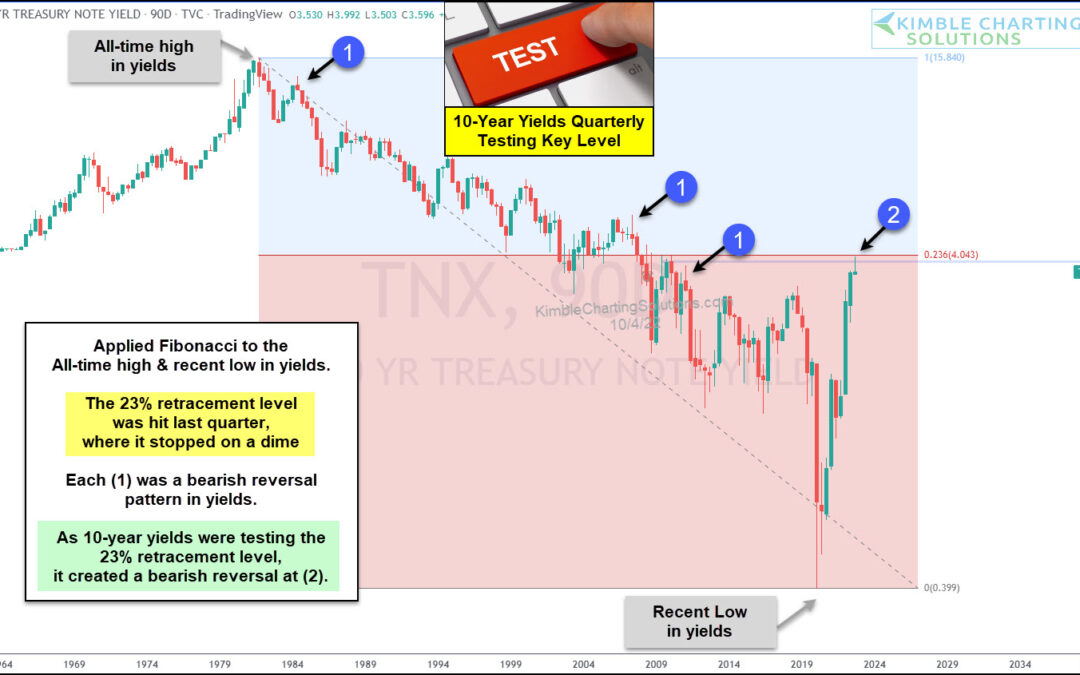
by Chris Kimble | Oct 5, 2022 | Kimble Charting
During the 3rd quarter of this year, we saw the 10-year treasury bond yield reach its highest level in nearly 15 years! This corresponded with mortgage rates reaching levels we hadn’t seen in some time. And all this is occurring while the Federal Reserve raises...
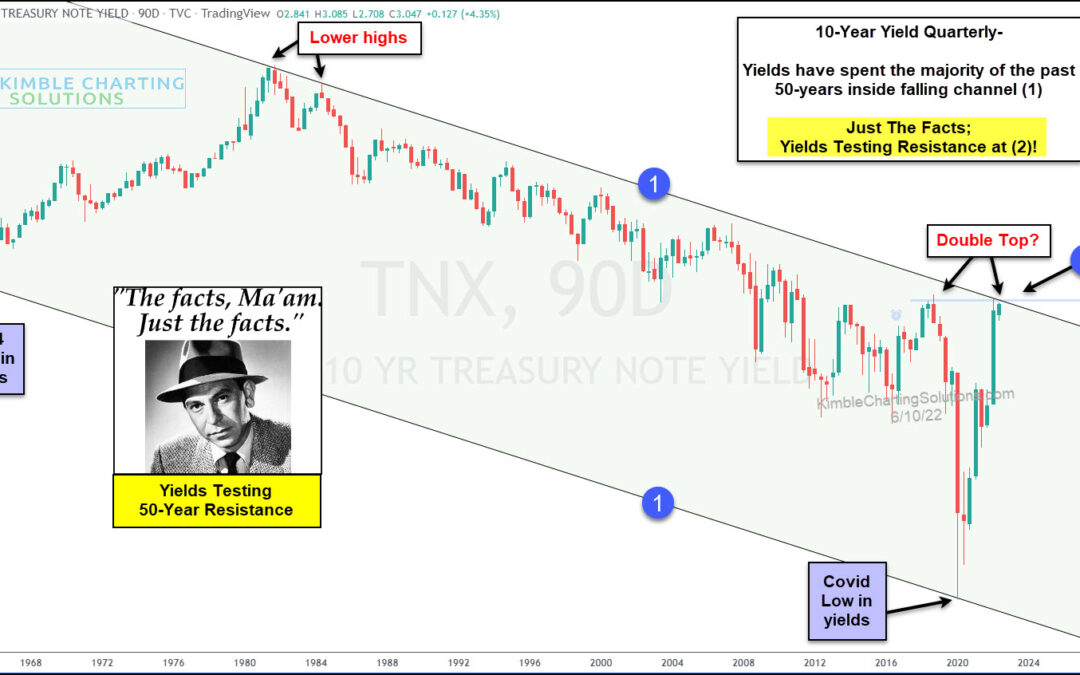
by Chris Kimble | Jun 10, 2022 | Kimble Charting
Have interest rates gone up enough? Odds are high, this question is on the minds of global investors. This chart looks at the 10-year yield, on a quarterly basis, since 1963. For more than 50-years, yields have created lower highs and lower lows inside of falling...
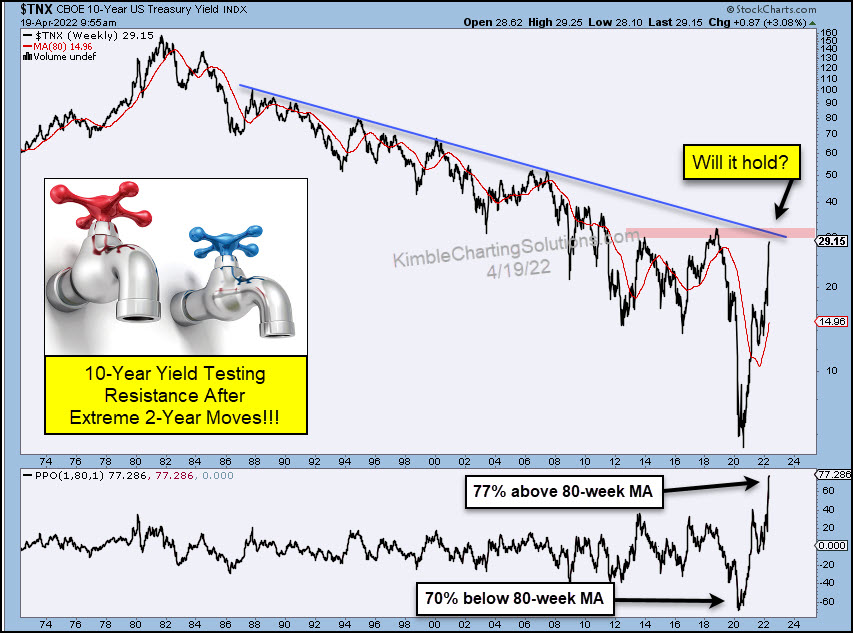
by Chris Kimble | Apr 20, 2022 | Kimble Charting
It’s been a crazy past couple of years for the 10-year US treasury bond yields and interest rates. The crazy extremes have seen rates fall to near zero and his back up near 3 percent. We can see this in today’s long-term chart of the 10-Year US treasury bond yield. As...
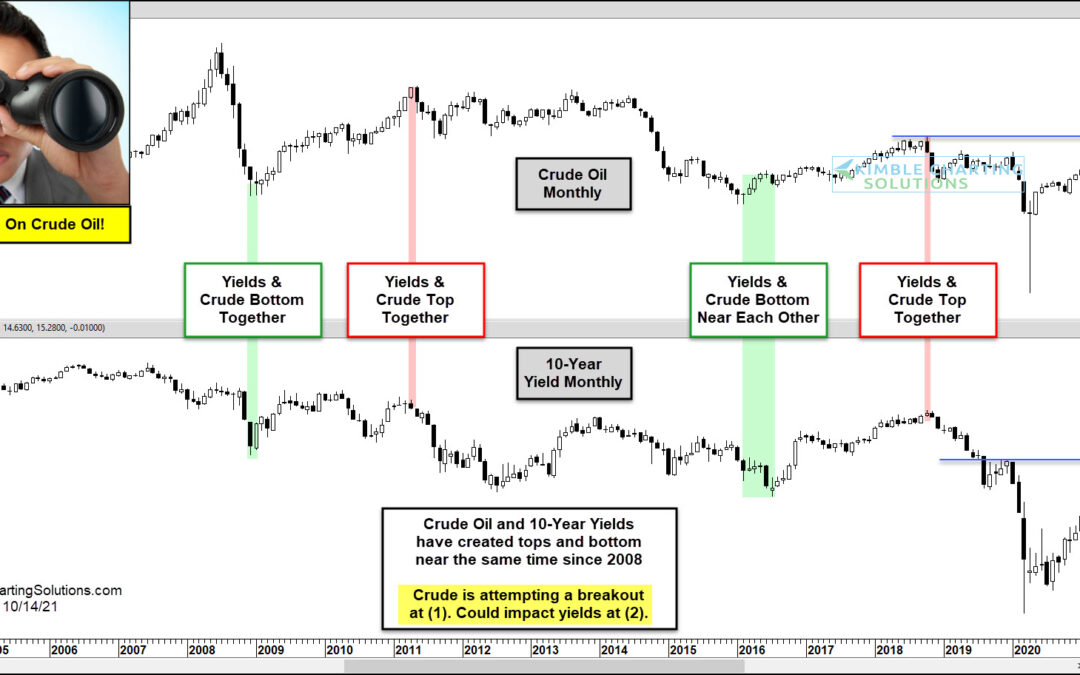
by Chris Kimble | Oct 15, 2021 | Kimble Charting
When crude oil prices rise, investors typically think of an improving global economy. But when crude oil price rise sharply (by a large amount over a short duration), investors worry about supply issues and/or inflation. Today, both concerns are becoming more and more...
