
by Chris Kimble | Aug 3, 2015 | Kimble Charting
CLICK ON CHART TO ENLARGE This chart looks at the yield on the 30-year bond. Yields rallied strongly from the first of February to the first of July (up 30%). This strong rally in yields hit dual resistance at (1) above, which was the 38% retracement level and the...

by Chris Kimble | Jun 5, 2015 | Kimble Charting
Just the Facts….Bond troubles could just be starting if….. CLICK ON CHART TO ENLARGE This chart looks at the 10 and 30-year yields. Each could be making “Head & Shoulders” bottoming patterns. If this pattern read is correct, each are...

by Chris Kimble | Jun 3, 2015 | Kimble Charting
It is easy to find talk these days about the Fed moving interest rates higher. Humbly I don’t know what Janet will do next. Could it be more important what billions of free thinking people do with bond positions they have at the cross roads below? From a price...
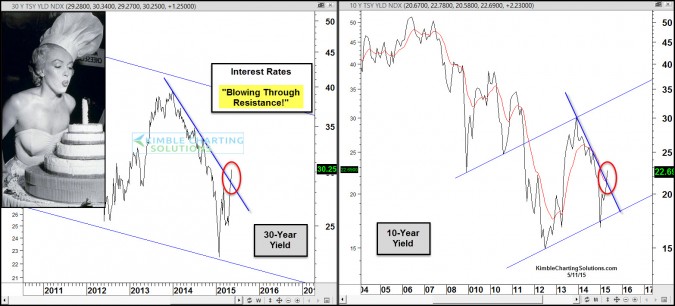
by Chris Kimble | May 11, 2015 | Kimble Charting
CLICK ON CHART TO ENLARGE Rates have been on the rise since the first of February this year! Both the 30-Year Bond and 10-Year note are blowing right through resistance of late. Bond players might want to respect this breakout above 2-year falling resistance! ...
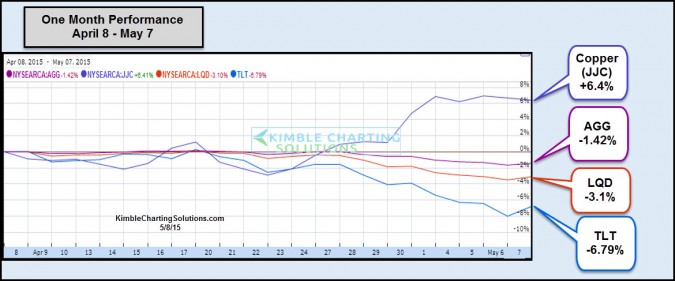
by Chris Kimble | May 8, 2015 | Kimble Charting
CLICK ON CHART TO ENLARGE Are bonds scared of Doc Copper heading higher? Are bonds scared of Crude Oil heading higher? Are bonds scared of the employment stats getting stronger? Humbly I don’t know the answers to these questions. I do know this from a price...

by Chris Kimble | May 6, 2015 | Kimble Charting
Is the Fed losing control over interest rates? I’ve heard a rumor that the Fed is in control of interest rates. If this is true, is Janet raising rates and not telling anyone? The table below looks at the performance of the yields on the 10 & 30-year notes...

by Chris Kimble | Feb 4, 2015 | Kimble Charting
CLICK ON CHART TO ENLARGE The yield on the 10-year note rose almost 9% the past couple of days, does that mean a new trend is in play? Joe Friday says….Just the facts ma am and the facts are, the yield on the 10-year note is in a down trend! The decline...

by Chris Kimble | Jan 8, 2015 | Kimble Charting
CLICK ON CHART TO ENLARGE 30-year yields could be at a triple bottom and the 10-year yield could be making a bullish inverse head and shoulders pattern/creating bullish wicks at the right shoulder. Seem unlikely? I understand if you think so. If you would like...
