
by Chris Kimble | Jul 8, 2013 | Kimble Charting
CLICK ON CHART TO ENLARGE On May 2nd the Power of the Pattern suggested that interest rates were about to blast off. The chart above reflected a bullish inverse head & shoulders pattern in yields was in place, with the right shoulder on support (see post here)....

by Chris Kimble | Jun 20, 2013 | Kimble Charting
CLICK ON CHART TO ENLARGE One of the better global leading indicators has created a bearish descending triangle over the past couple of years and a breakdown of support looks to be taking place this morning. Where do people hide if this leading global indicator breaks...

by Chris Kimble | Jun 12, 2013 | Kimble Charting
CLICK ON CHART TO ENLARGE “The Perfect Storm” for most portfolios would be… stocks and bonds fall at the same time! The above 2-pack reflects a couple of key support lines for bonds and stocks are being pushed on very hard! If this action...
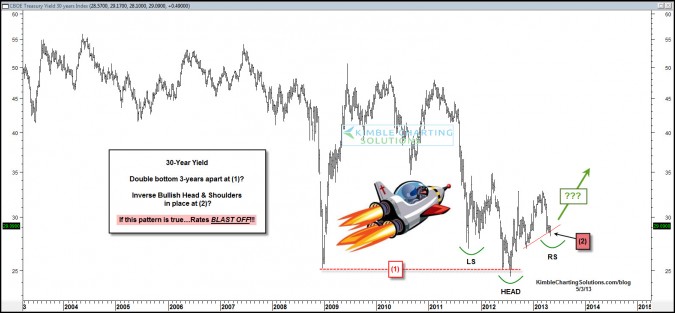
by Chris Kimble | May 3, 2013 | Kimble Charting
CLICK ON CHART TO ENLARGE I’ve been sharing this pattern with members for a couple of weeks. The 30-year yield may have created a multi-year double bottom at (1) and could have created a multi-year bullish inverse head & shoulders pattern at (2). Yes the...

by Chris Kimble | Mar 28, 2013 | Kimble Charting
CLICK ON CHART TO ENLARGE Many view Copper as a quality leading indicator for the global economy. The weakness of late has Copper in the upper left giving a multi-year support line its biggest test in three years. Do we have a breakdown at hand and a macro...
by Chris Kimble | Feb 8, 2013 | Kimble Charting
CLICK ON CHART TO ENLARGE U.S. Treasury Inflation Protected Securities (TIPS) are designed to help “Protect” bond holders against inflation. Joe Friday….Of late the CRX Commodity index has rallied and TIPS and many other Government bonds have...

by Chris Kimble | Feb 1, 2013 | Kimble Charting
Gomer pointed out that the long-term bond yield looked to be be making a “Bullish inverse Head & Shoulders” at a double bottom, 100 days ago, in the chart below. (see post here) The Power of the Pattern was reflecting these bullish situations...

by Chris Kimble | Jan 7, 2013 | Kimble Charting
CLICK ON CHART TO ENLARGE Many discuss the potential for much higher inflation, due to the action of the Central Bankers (excess printing of money). The MS Commodity Index (CRX) and the Yield on the 30-Year bond (TYX) are two indicators that are sensitive to inflation...
