877-721-7217 services@kimblechartingsolutions.com
  • Twitter
  • Twitter
  • Terms of Use
  • Contact
0 Items
Kimble Charting Solutions
  • Blog Sign Up
  • Free Research (Blog)
  • Research Subscriptions
    • Most Popular Research
    • Premium Member Research
    • Weekly Research Reports
  • What We Do
    • What We Do For You
    • Charts Solve These Investing Challenges
    • What You Receive
  • About Us
    • About Us
    • Testimonials
    • Videos
    • As Seen On
  • Login
Select Page
Amazon breaks 5-year support, as weakness after Drone high continues!

Amazon breaks 5-year support, as weakness after Drone high continues!

by Chris Kimble | Oct 25, 2014 | Kimble Charting

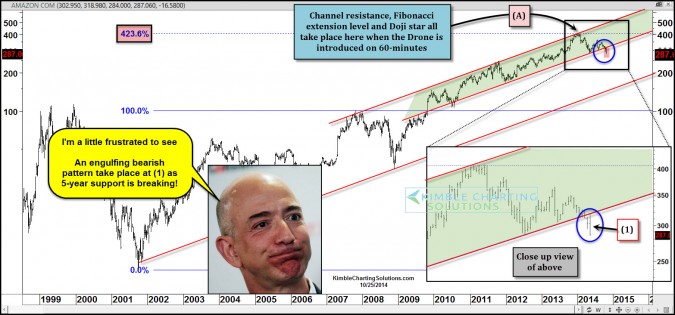
  CLICK ON CHART TO ENLARGE The Power of the Pattern highlighted several months ago that Amazon looked to have created a top at the same time the new drone was introduced on 60-Minutes at (A) above. As mentioned above, when the Drone was being introduced, AMZN...
Amazon continues weak after “Drone High” was put in!

Amazon continues weak after “Drone High” was put in!

by Chris Kimble | Jul 24, 2014 | Kimble Charting

  CLICK ON CHART TO ENLARGE Jeff Bezos was a guest on the show 60 minutes a few months back, to announce that Amazon might deliver packages via a drone. At the time of his announcement, AMZN was hitting the top of a 6-year channel resistance line and a Fibonacci...
Joe Friday….Amazon breaks support after “Drone High” takes place!

Joe Friday….Amazon breaks support after “Drone High” takes place!

by Chris Kimble | Apr 25, 2014 | Kimble Charting

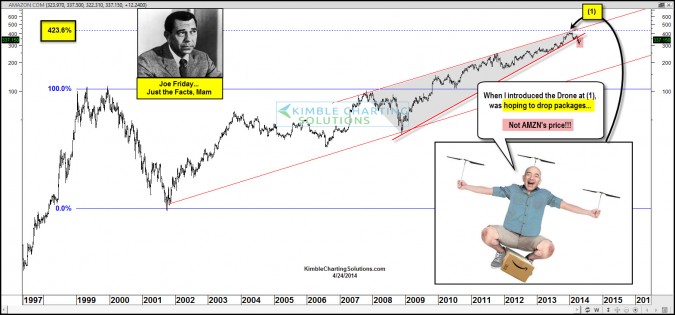
  CLICK ON CHART TO ENLARGE Amazon was forming a bearish rising wedge and was nearing its Fibonacci 423% extension level about the time Jeff Bezo went on 60 minutes to announce the new “Drone” delivery program.  Joe Friday….Amazon looks to...
Fibonacci impacted Gold’s 10-year rally, could it block Amazon’s progress this time?

Fibonacci impacted Gold’s 10-year rally, could it block Amazon’s progress this time?

by Chris Kimble | Jan 28, 2013 | Kimble Charting

CLICK ON CHART TO ENLARGE In the Summer of 2011, the Power of the Pattern reflected that Gold was facing key obstacles, which was its 261% Fibonacci extension level at the top of its 10-year rising channel at (1).  I shared that this resistance could be a tough...
GAGA indicator sending an important sell signal?

GAGA indicator sending an important sell signal?

by Chris Kimble | Nov 7, 2012 | Kimble Charting

CLICK ON CHART TO ENLARGE GAGA Indicator (Google, Apple, General Electric & Amazon) are all breaking key support lines at the same time.  Three of the four stocks in the above 4-pack turned up before the 500 index did in 2009.  Now two of the three are...
Next Entries »

Topic Areas

10-year yield Apple Banks bonds China Commodities Copper CRB Index Crude Oil DAX Doc Copper Dollar Update Dow Jones Emerging Markets Euro GDX gdxj gld gold Gold Bugs Gold Stocks Govt. bonds High Yields Interest Rates Joe Friday Junk Bonds Kimble Charting NASDAQ 100 ndx 100 NYSE Composite QQQ real estate Russell 2000 S&P S&P 500 Shanghai index silver slv SPX spy TLT US dollar What would you do? Wilshire 5000 Yields
  • Terms of Use
  • Contact
  • Twitter

Copyright ©2022 Kimble Charting Solutions. All Rights Reserved | Design by 16Wells