by Chris Kimble | Feb 5, 2018 | Kimble Charting
Last week the Power of the Pattern shared that most “FAANG stocks were testing the top of rising channels/breakout levels.” The one exception to that was Apple. Below looks at Apple over the past couple of years- CLICK ON CHART TO ENLARGE The trend of...

by Chris Kimble | Feb 1, 2018 | Kimble Charting
FAANG stocks (Facebook, Amazon, Apple, Netflix & Google) have done extremely well over the past couple of years and the trend all five remains higher. Below looks at each of these 5 stocks as well as the S&P 500 and the patterns they have created- CLICK ON...
by Chris Kimble | Nov 10, 2015 | Kimble Charting
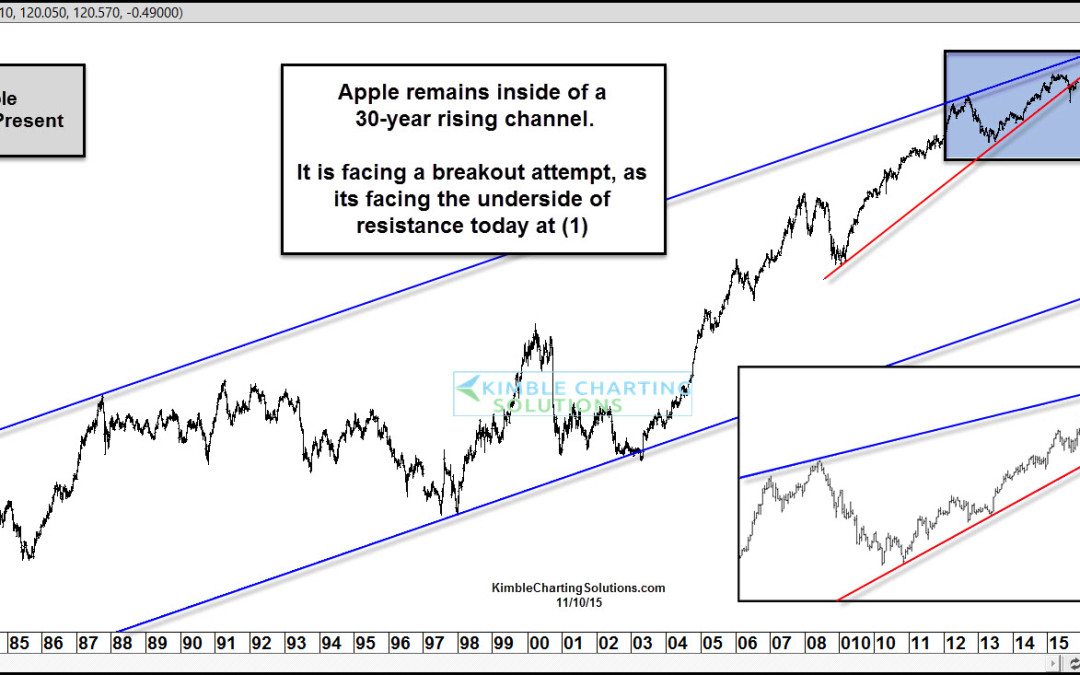
No doubt, Apple remains inside of a 30-year rising channel, reflected in the chart below. Also, a key “KISS” seems to be taking place as well! CLICK ON CHART TO ENLARGE Apple has rallied of late, after a sharp decline that started back in May of this year....
by Chris Kimble | Aug 4, 2015 | Kimble Charting
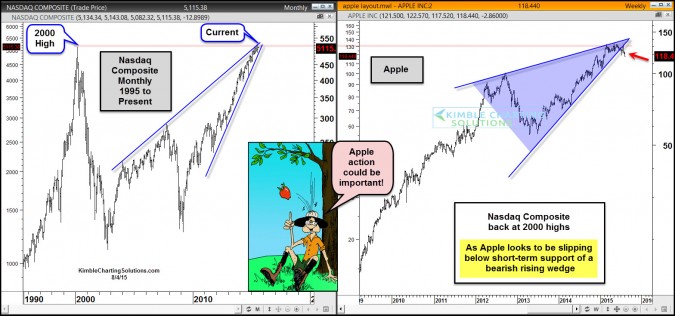
CLICK ON CHART TO ENLARGE The left chart looks at the Nasdaq Composite index over the past 20-years. Currently the index is back at the same price as it was back at the Dot Com highs. With the trend being up (above support and moving averages) the NAS, is attempting a...
by Chris Kimble | Jul 10, 2015 | Kimble Charting
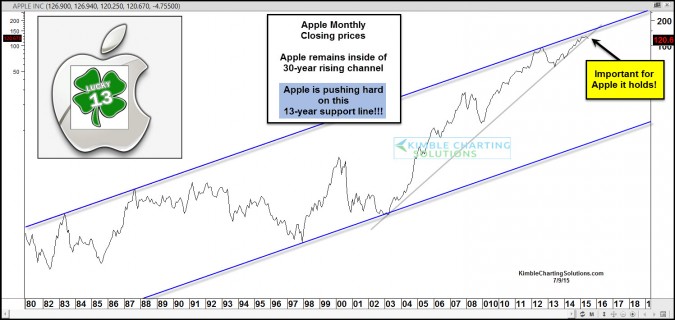
CLICK ON CHART TO ENLARGE With Apple being the largest company in the world, what Apple does has ripple effects that are beyond measure. First off, Apple remains inside of a 35-year rising channel. Of late it was within 15% of hitting the top of its channel. No doubt...
by Chris Kimble | Jun 23, 2015 | Kimble Charting
The worlds largest company has been rather quiet the past 4-months! The table below highlights that Apple has mostly traded sideways of late and its down a little over 1% since February 23rd. CLICK ON CHART TO ENLARGE Is this sideways action about to end? It looks...

by Chris Kimble | Jun 11, 2015 | Kimble Charting
The chart below takes a look at Apple, as it could be creating a bullish reversal pattern (wick) at dual support. If this is true and should it push higher, it could help the Nasdaq Composite index avoid a double top pattern. CLICK ON CHART TO ENLARGE Apple looks to...
by Chris Kimble | Apr 27, 2015 | Kimble Charting
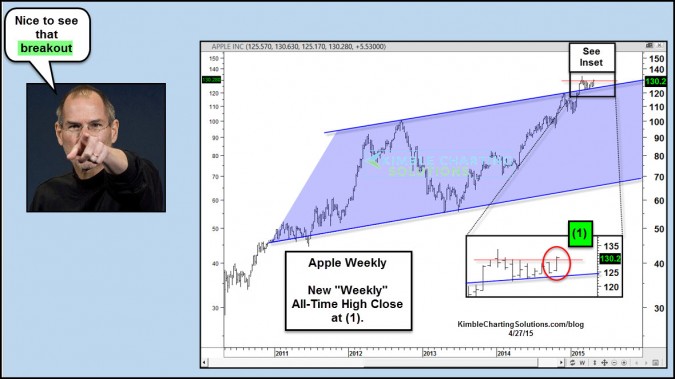
CLICK ON CHART TO ENLARGE Apple closed last week at an all-time weekly closing high at (1) in the chart above. Apple recently broke above its 4-year rising channel, came back to test old resistance and pushed higher, setting this new record high. In November of last...


