by Chris Kimble | Jun 18, 2020 | Kimble Charting
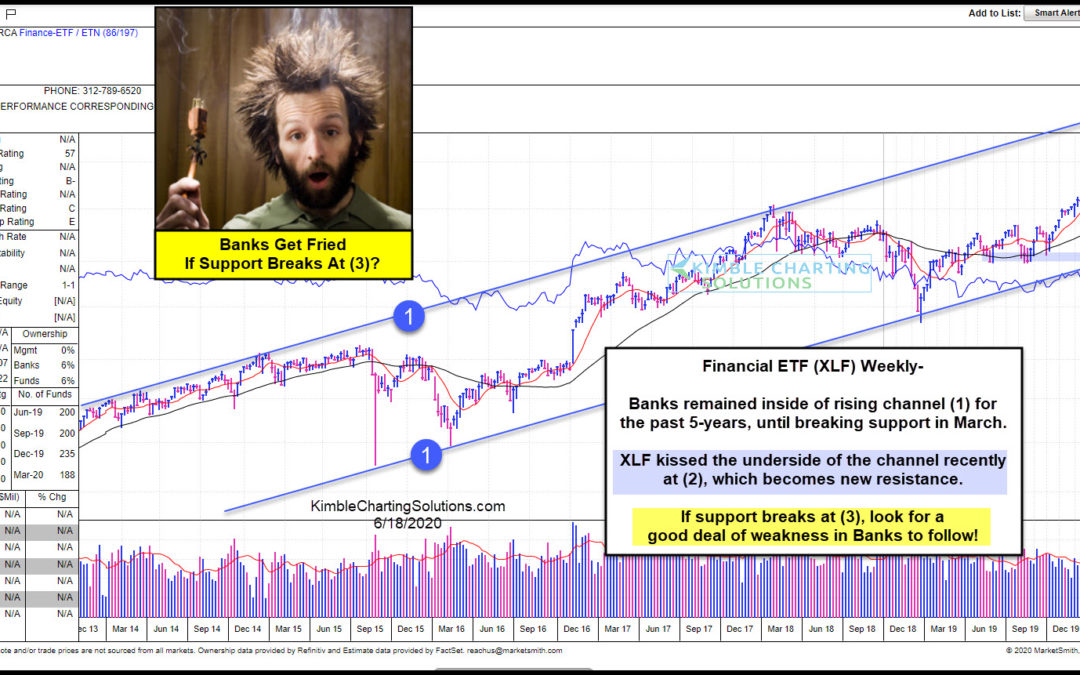
Are banks about to get fried? Sure could if current support fails to hold! This chart looks at Financial ETF (XLF) from Marketsmith.com on a weekly basis over the past 7-years. XLF has remained inside of bullish rising channel (1) for the past 5-years. Weakness took...
by Chris Kimble | Jun 12, 2020 | Kimble Charting
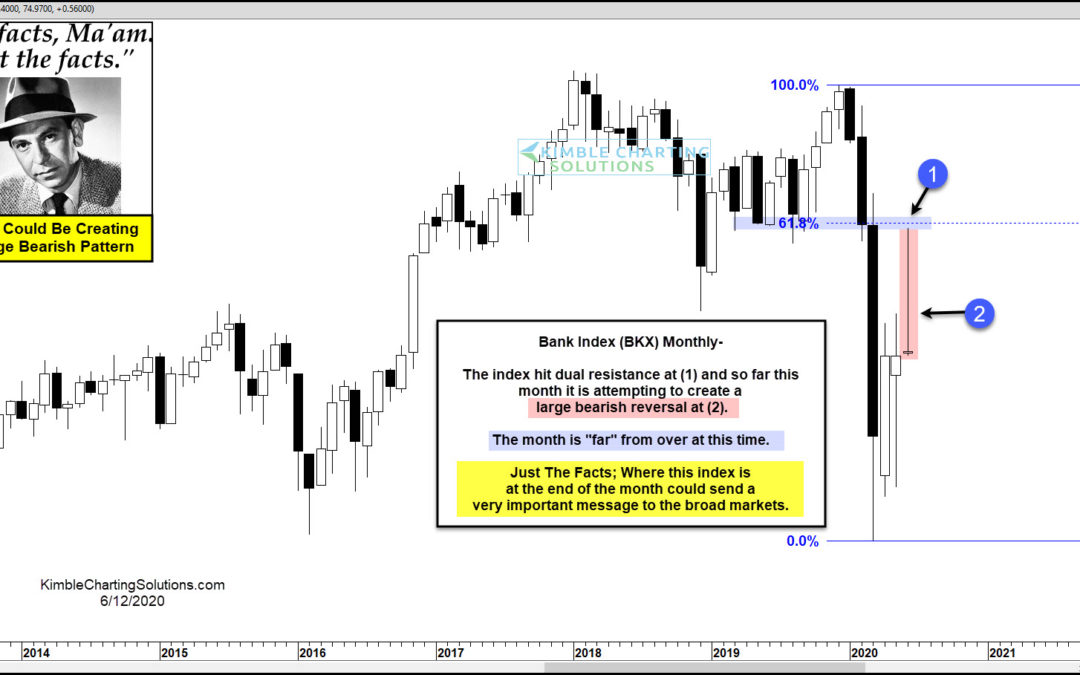
Are Banks going to end the month with a large bearish pattern just below dual resistance? Possible, yet the month is far from over! This chart looks at the Bank Index (BKX) on a monthly basis. The rally this month took it up to test its 61% retracement level and old...
by Chris Kimble | Jun 9, 2020 | Kimble Charting
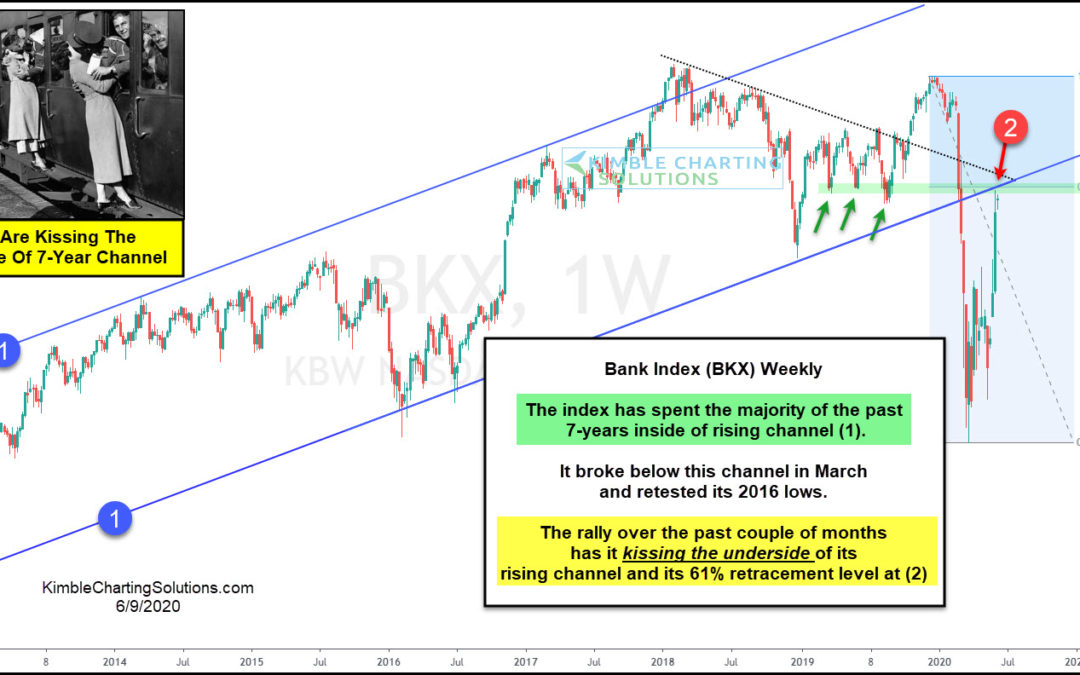
If Banks peak here would they send a caution message to the stock rally over the past couple of months? Yes! This chart looks at the Bank Index (BKX) on a weekly basis since the summer of 2012. Since the lows in July of 2012, the index has spent the majority of the...
by Chris Kimble | May 13, 2020 | Kimble Charting
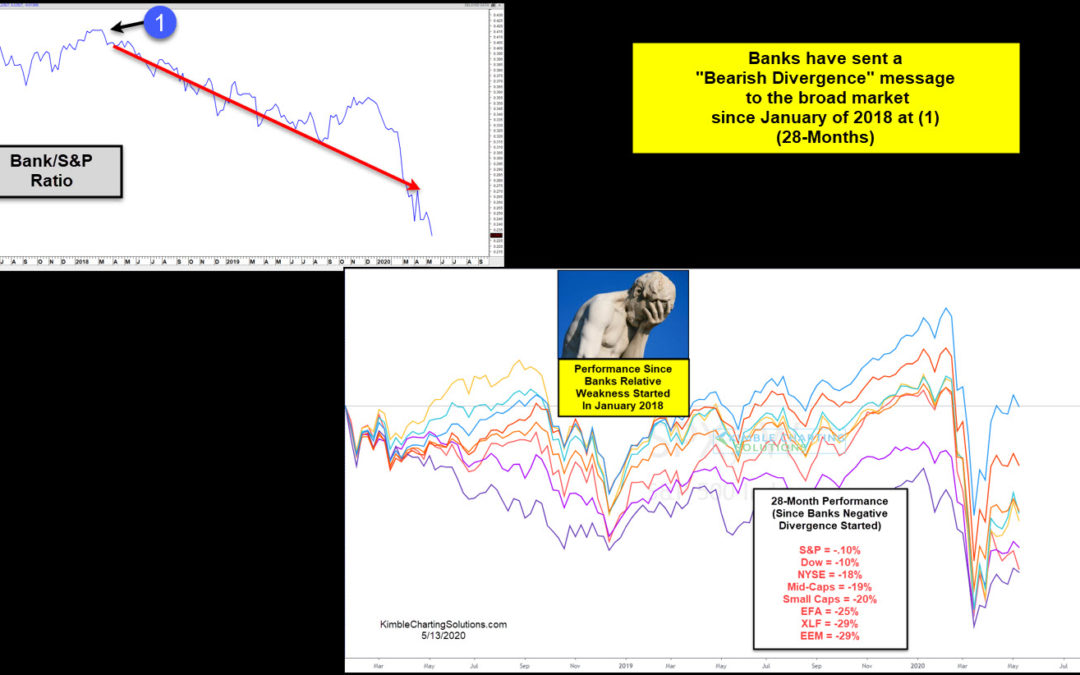
Is the saying “So Goes The Banks, So Goes The Broad Market” true? Over the past 28-months, it does appear to be accurate! Banks started underperforming the S&P 500 in January of 2018 (28-months ago) at (1) in the upper left chart. This weakness from...
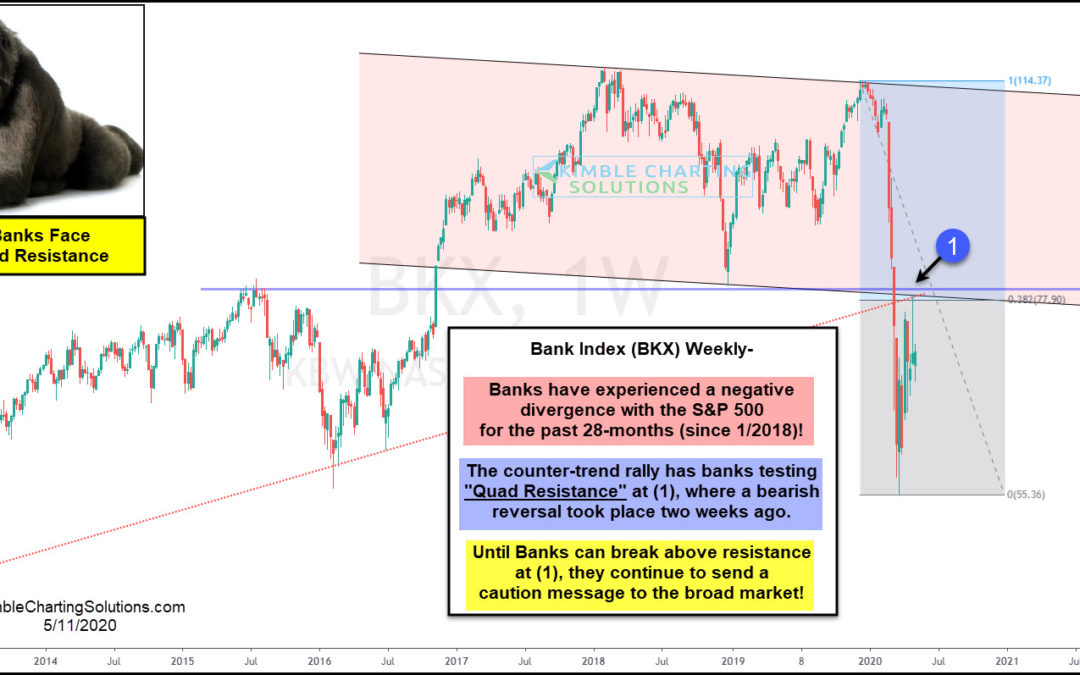
by Chris Kimble | May 11, 2020 | Kimble Charting
Is the Banking Index sending a caution message to stocks? It has for the past 28-months and it is experiencing a major resistance test of late! The Banking Index (BKX) started underperforming the broad market back in January of 2018, which created a negative...
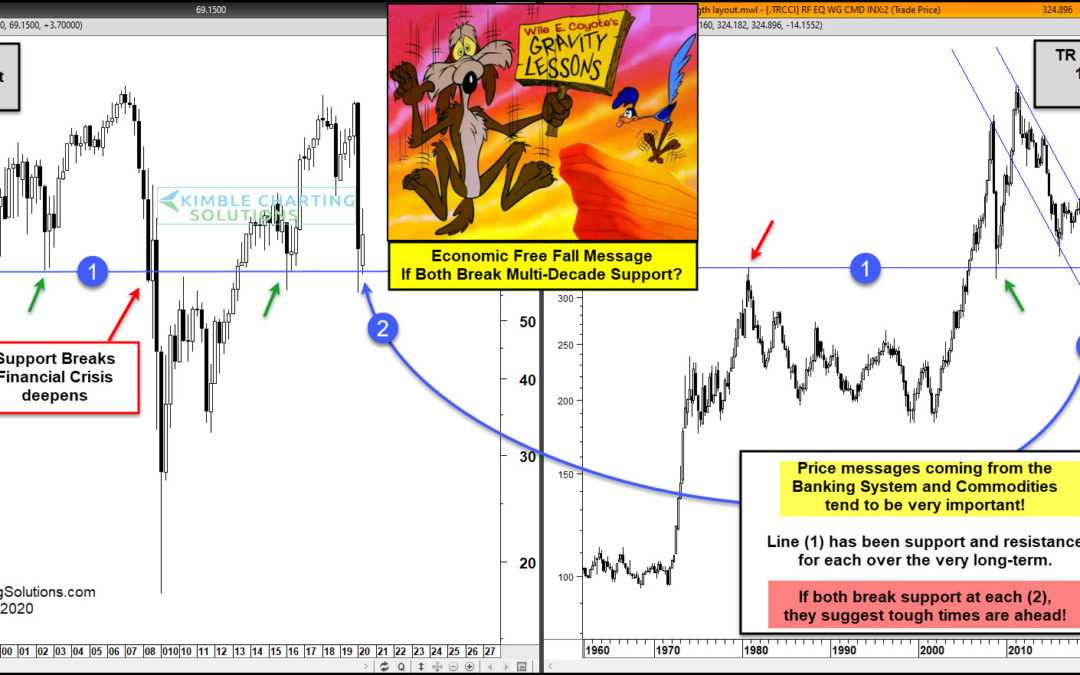
by Chris Kimble | Apr 21, 2020 | Kimble Charting
Is the “Mother of all support tests in play currently?” It humbly looks like it to me friends! This 2-pack looks at the Banking Index and the Thomson Reuters Equal Weight Commodity Index on a quarterly basis over the past few decades. Line (1) has been...
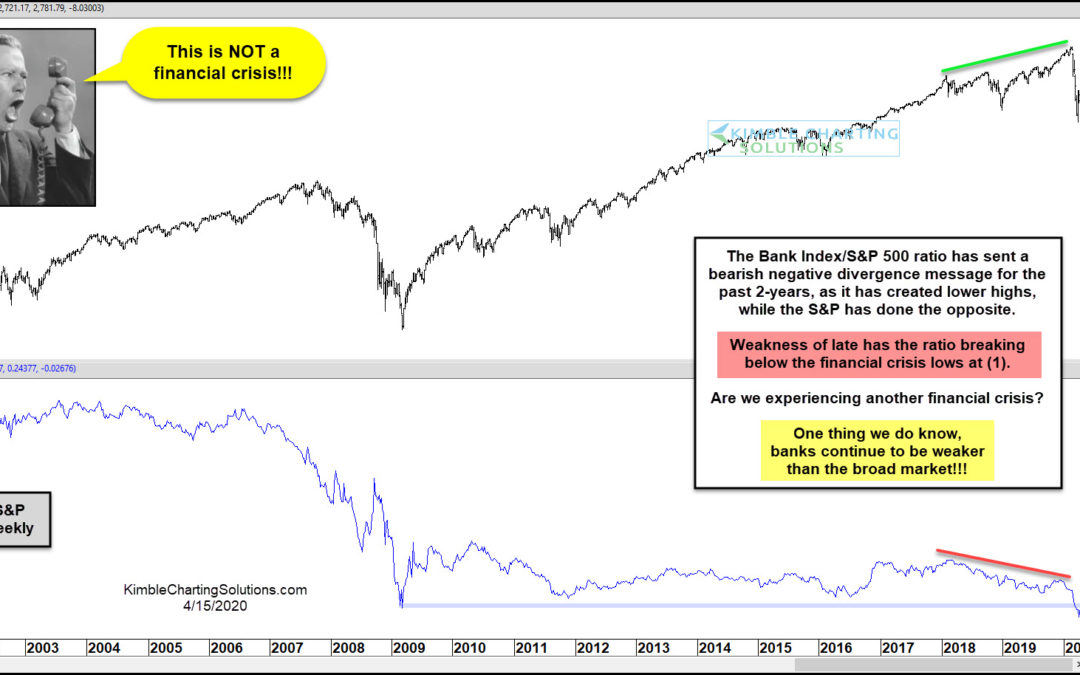
by Chris Kimble | Apr 16, 2020 | Kimble Charting
S&P 500 Index (top pane) vs Bank Index to S&P 500 Ratio (lower pane) As most investors know, the banks play a big role in the overall economy. Healthy banks tend to mean a healthy economy and struggling banks tend to mean an uneven or faltering economy. In...
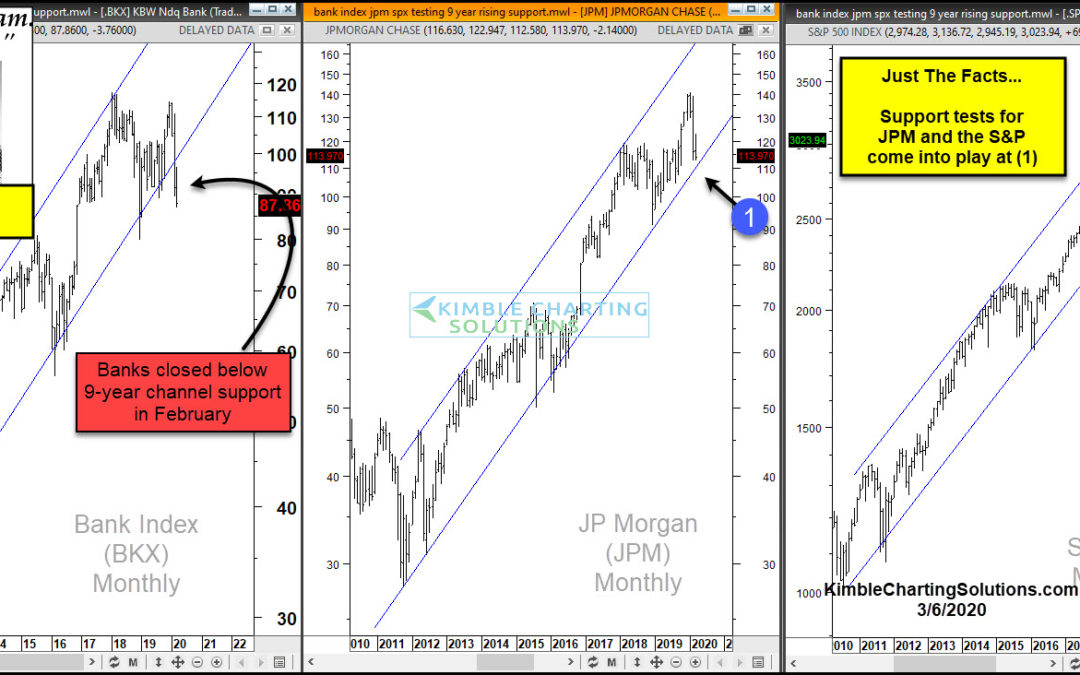
by Chris Kimble | Mar 6, 2020 | Kimble Charting
By now you are most likely aware that the S&P 500 just experienced its quickest 10% decline in its history. Did this decline break long-term rising channels? Check out the 3-pack above. This 3-pack takes a monthly look at the Bank Index (BKX), JP Morgan (JPM) and...
