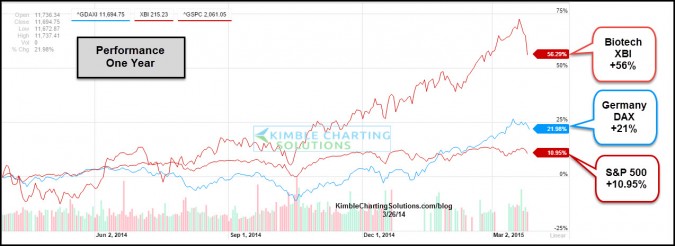
by Chris Kimble | Mar 26, 2015 | Kimble Charting
CLICK ON CHART TO ENLARGE I am a fan of watching leadership. When leaders get into trouble, they can have a huge influence over the broad markets. The above chart looks at the S&P 500 and the hottest sector and hottest key global stock index of late. Over the past...

by Chris Kimble | Oct 15, 2014 | Kimble Charting
We’ve all heard….Good pitching stops good hitting. Defense wins championships. When it comes to being defensive in the investment world, investors have several strategies they can apply. The simplest is to “Harvest” assets near highs (reduce long...

by Chris Kimble | Sep 15, 2014 | Kimble Charting
CLICK ON CHART TO ENLARGE Tesla and Bio Tech have been great performers over the past 24 months. Earlier this year both of them gave back some of there gains and then started another impressive rally. Both are making attempts to make strong closes above highs...

by Chris Kimble | Jul 16, 2014 | Kimble Charting
CLICK ON CHART TO ENLARGE At the beginning of March I ask if investors were interested in “Buying these Dips” in Bio Tech, Tesla and Google. The only issue was, these charts were inverted and each was hitting a key Fibonacci extension level. ...

by Chris Kimble | Jun 25, 2014 | Kimble Charting
CLICK ON CHART TO ENLARGE White hot Bio-Tech received a punch in face between March 1st to April the 15th, losing 20% of its value. Since mid April IBB has been attempting to recover from that decline. The rally over the past two months has recovered all but...
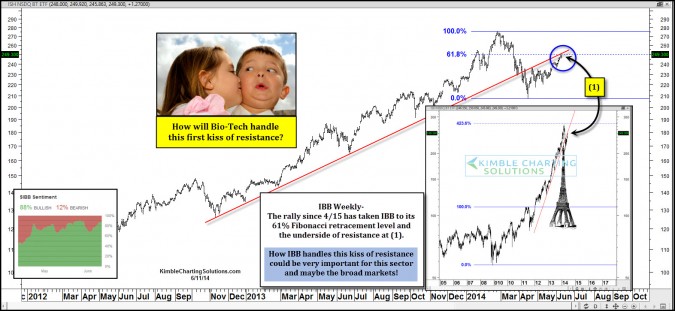
by Chris Kimble | Jun 11, 2014 | Kimble Charting
CLICK ON CHART TO ENLARGE Did Bio-Tech hit a long-term high on the week of February the 28th? The jury is still out on this question I feel. We could find out a good deal about this question in the next week! Bio-Tech peaked around the first of March and fell...
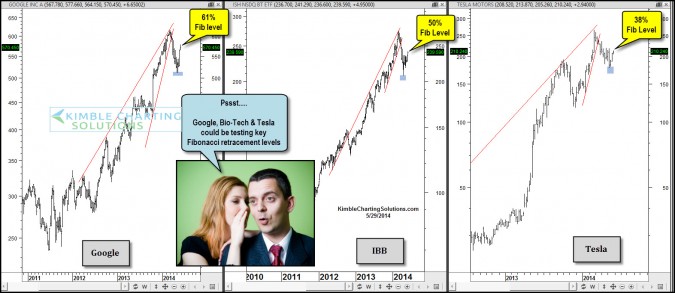
by Chris Kimble | May 29, 2014 | Kimble Charting
CLICK ON CHART TO ENLARGE Almost 90 days ago I shared the 3-pack below, where I inverted Google, Bio-Tech and Tesla, which reflected that each had formed bullish falling wedges. Since the charts were inverted, they were suggesting that each of these three were...

by Chris Kimble | May 9, 2014 | Kimble Charting
CLICK ON CHART TO ENLARGE Ten weeks ago this morning (2/28), the Power of the Pattern reflected in the chart below that the white hot Bio-Tech sector looked to be hitting Fibonacci & Channel resistance and could be peaking and forming an “Eiffel...
