
by Chris Kimble | Nov 19, 2013 | Kimble Charting
CLICK ON CHART TO ENLARGE What does the French, London, Hang Seng, China, S&P 500 & German stock markets have in common? The answer isn’t that they are all at all-time highs! What they all have in common is that each are attempting to breakout of...
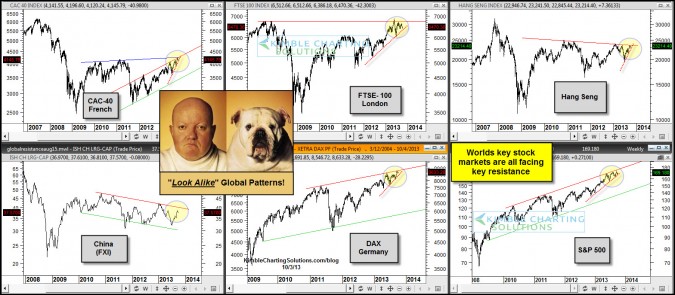
by Chris Kimble | Oct 3, 2013 | Kimble Charting
CLICK ON CHART TO ENLARGE When you take a look around the world, key stock markets all are facing resistance with several of them creating bearish rising wedge patterns that suggest lower prices take place two-thirds of the time! –...
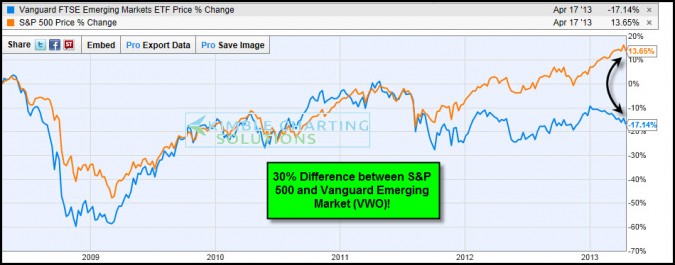
by Chris Kimble | Apr 18, 2013 | Kimble Charting
CLICK ON CHART TO ENLARGE Emerging markets are the growth engines of the world? Heard this pitch for years? Could this pitch be the reason that 2 of the 4 largest ETF’s in the world are Emerging markets ETF’s, despite relative weak performance...

by Chris Kimble | Mar 26, 2013 | Kimble Charting
The 6-pack below reflects that BRIC ( Brazil, Russia, India & China) and Emerging markets are close to or are breaking key support lines. CLICK ON CHART TO ENLARGE Many pundits continue to tell us that Emerging markets are the growth engine of the...

by Chris Kimble | Mar 21, 2013 | Kimble Charting
CLICK ON CHART TO ENLARGE 35% of the blogs viewership is from outside of the United States, reflected in the chart below. I am deeply humbled by the global viewers that come to the blog daily. Thank you. The above 6-pack reflects that the DAX, CAC-40 &...

by Chris Kimble | Feb 4, 2013 | Kimble Charting
Much attention is being directed towards the S&P 500, as it nears its 2007 highs. From a performance perspective over the past 6 month, the chart below reflects the S&P 500 is very weak, compared to key global markets. CLICK ON CHART TO ENLARGE In the...

by Chris Kimble | Dec 17, 2012 | Kimble Charting
Is Santa Claus bringing good cheer to the Emerging markets complex this year? The chart below reflects that BRIC ETF’s/Emerging markets are reflecting relative strength compared to the S&P 500 over the past 60 days. CLICK TO ENLARGE The 4-pack below reflects...

by Chris Kimble | Dec 10, 2012 | Kimble Charting
CLICK ON CHART TO ENLARGE While the media seems focused on the “Fiscal Cliff,” are investors getting distracted from a “Fiscally Strong performance” taking place in a ETF from China? China ETF (FXI) hit the bottom of the flag pattern above and...
