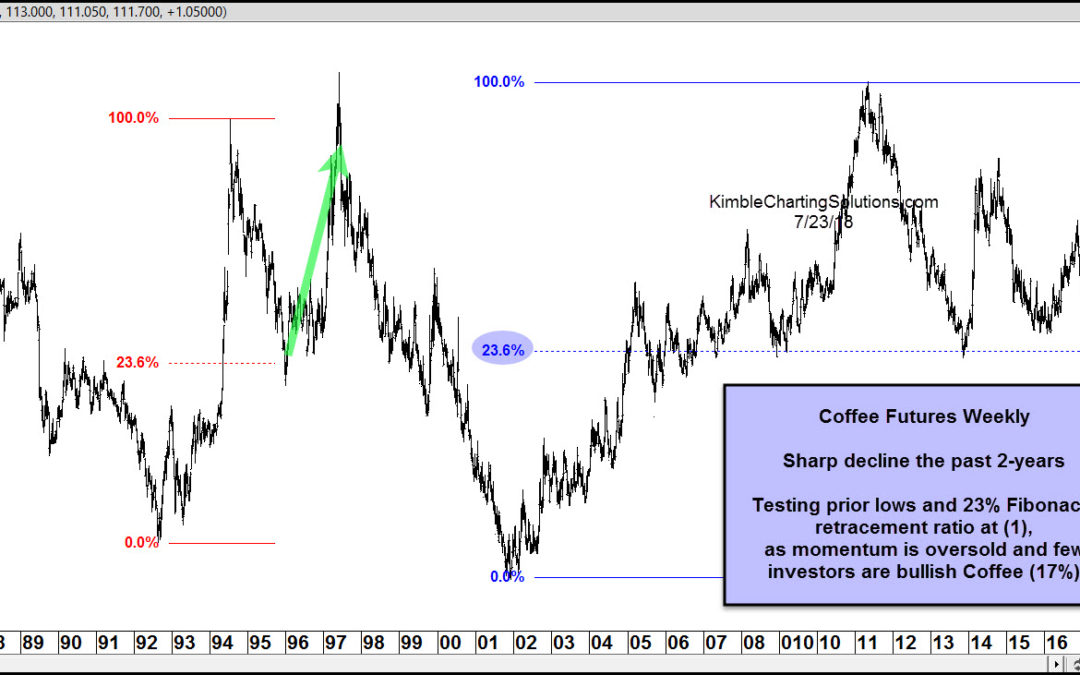
by Chris Kimble | Jul 23, 2018 | Kimble Charting
CLICK ON CHART TO ENLARGE Coffee hasn’t been perking well over the past 2-years, as it has declined nearly 40%. This sizeable decline has it testing the 2007, 2008 and 2013 lows, where rallies happened to get started. The current price is also testing the 23%...
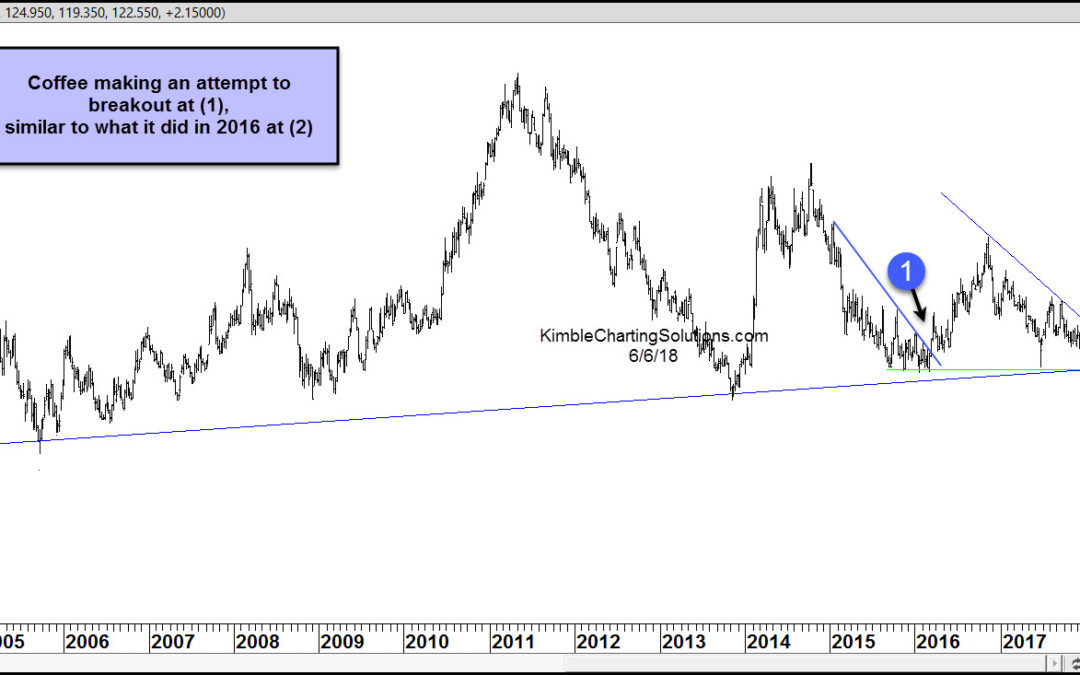
by Chris Kimble | Jun 6, 2018 | Kimble Charting
On Monday, we highlighted an important price pattern in the chart of the Thomson Reuters Equal-Weighted Commodities Index. Today, we’ll stick within that theme and look at two soft commodities trading setups: Coffee and Sugar (futures). In both cases, we have charts...
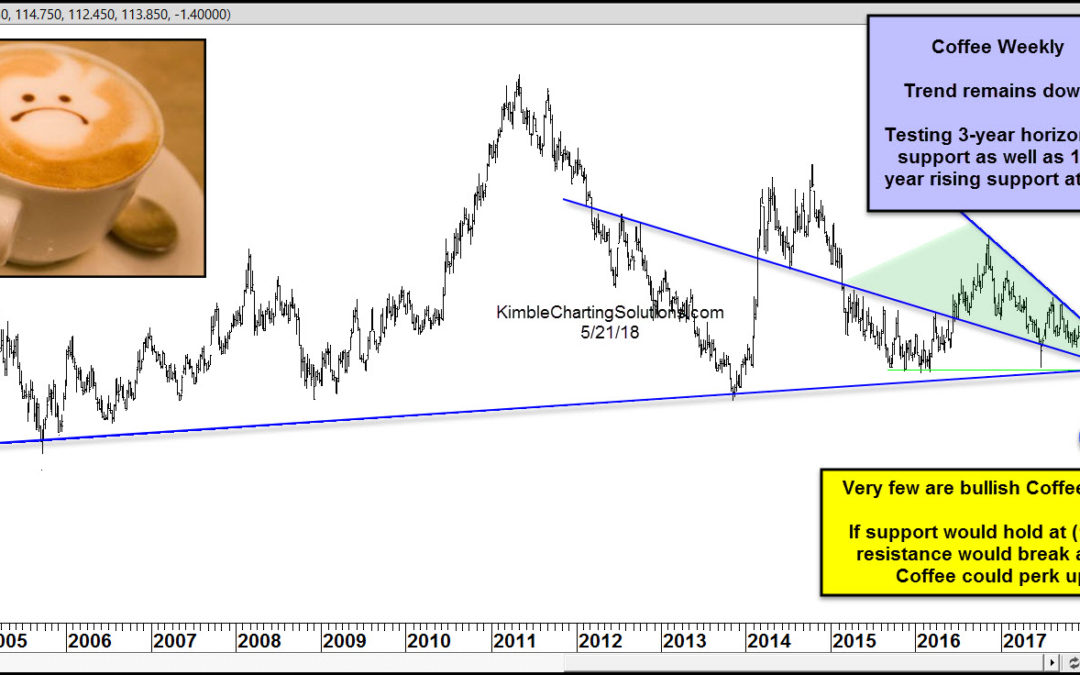
by Chris Kimble | May 21, 2018 | Kimble Charting
CLICK ON CHART TO ENLARGE The long and short-term trend for Coffee remains down. Coffee has lost nearly two-thirds of its value since the highs in 2011 and is nearly a third lower over the past 18-months. These declines have Coffee testing 2015 lows and a 14-year...

by Chris Kimble | Jul 28, 2017 | Kimble Charting
Coffee Futures and Coffee ETF (JO) have had a rough go of it the past few years. Below looks at the performance of both since 2011 CLICK ON CHART TO ENLARGE Could these large decline present an opportunity in Coffee? Sure could! Below looks at the chart of JO and what...

by Chris Kimble | Jul 13, 2017 | Kimble Charting
Coffee has been rather cold the past few years, as Coffee ETF (JO) has declined from $80 back in 2011 to $15 of late. This decline has created a interesting Power of the Pattern setup and drove away most bullish investors in Coffee. Below looks at Coffee ETF JO and...

by Chris Kimble | Jun 27, 2017 | Kimble Charting
Coffee has been anything but hot of late! Actually it has been pretty cold performance wise, as it has declined over 25% the past few months. Could this large decline become an opportunity? Could be, due to the pattern below. CLICK ON CHART TO ENLARGE The large...

by Chris Kimble | Jun 12, 2017 | Kimble Charting
Coffee may a joy to drink in the morning, yet being long it the past 6-months, has been a painful experience! Since last November, Coffee ETF (JO) has lost over 25% of its value. Could this decline be presenting an opportunity? Possible! Check out the chart of JO...
by Chris Kimble | May 1, 2017 | Kimble Charting
Coffee has been pretty ice cold since November of 2016, as its lost nearly a third of its value. Could this large 6-month decline turn into an opportunity? Below looks at Coffee ETF (JO) over the past few years. CLICK ON CHART TO ENLARGE The decline over the past...
