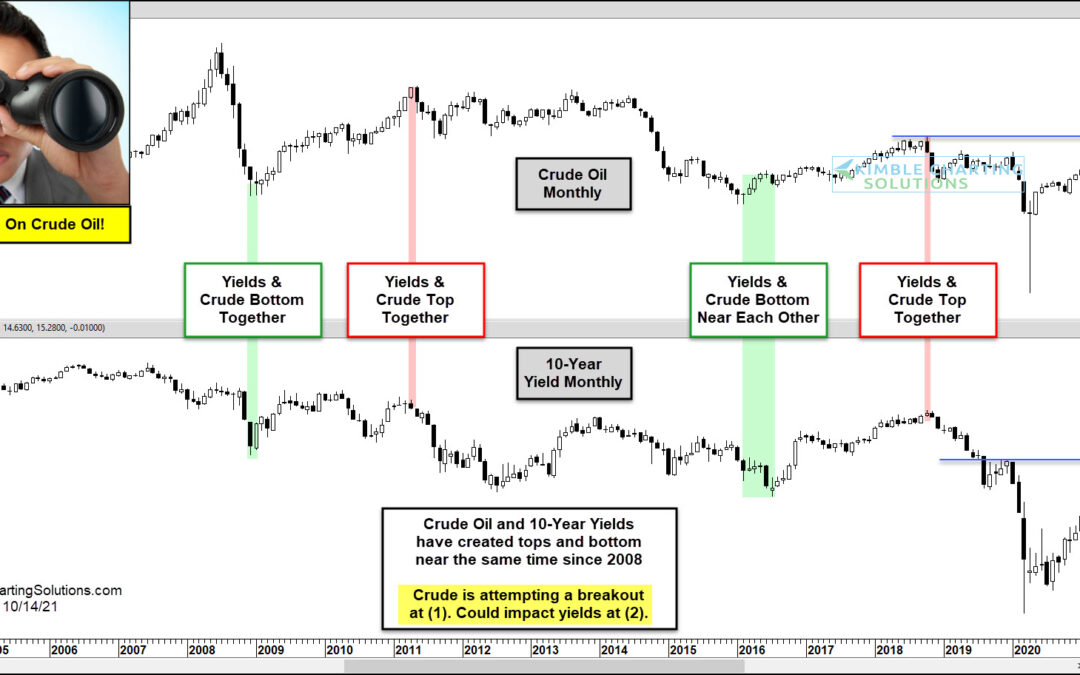
by Chris Kimble | Oct 15, 2021 | Kimble Charting
When crude oil prices rise, investors typically think of an improving global economy. But when crude oil price rise sharply (by a large amount over a short duration), investors worry about supply issues and/or inflation. Today, both concerns are becoming more and more...
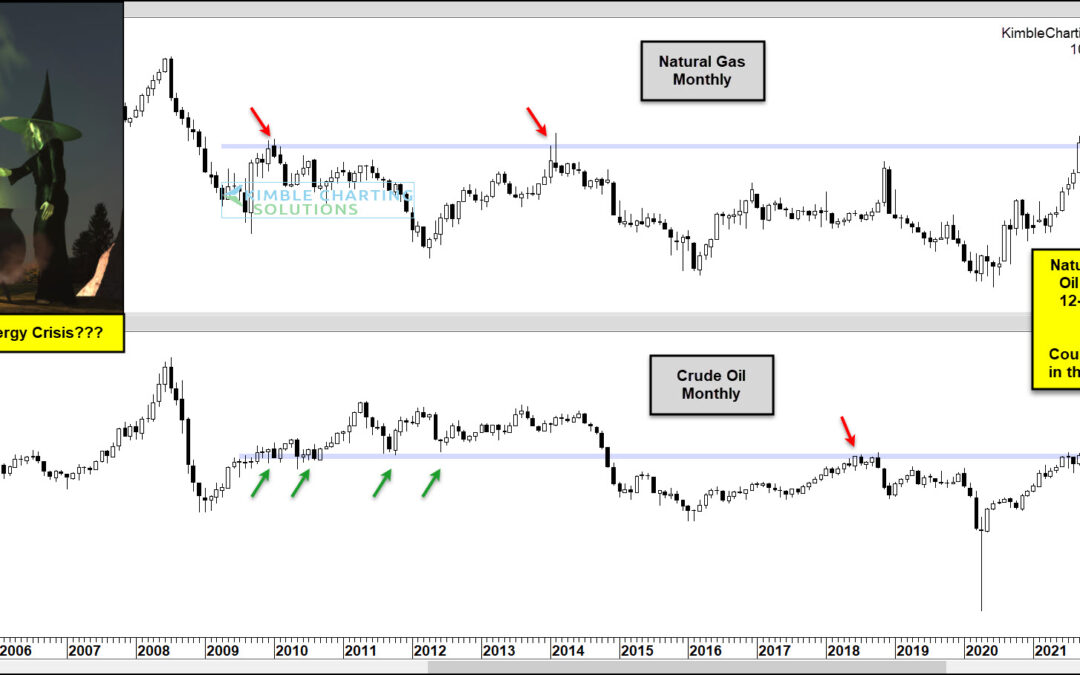
by Chris Kimble | Oct 6, 2021 | Kimble Charting
The coronavirus crash in the spring of 2020 left crude oil and natural gas prices decimated. An energy crisis was but a remote thought as oil and gas traded at multi-year lows. Fast forward to today and what a difference 18 months makes! Prices have surged. Late last...
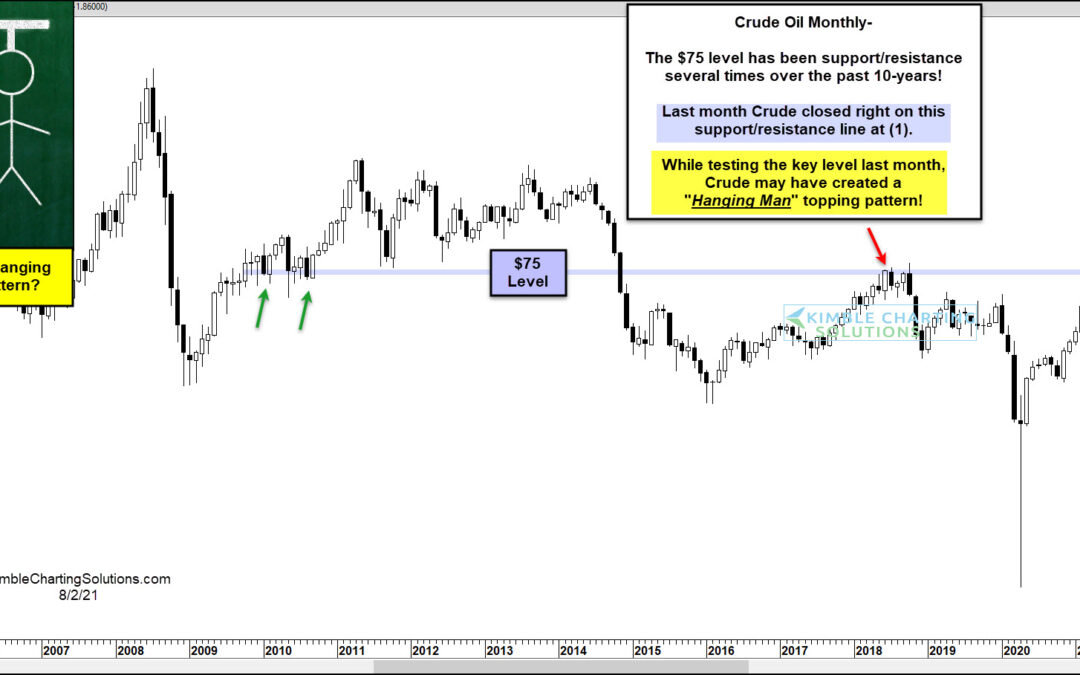
by Chris Kimble | Aug 4, 2021 | Kimble Charting
Several commodities have been on a tear higher over the past 18 months. This list of commodities includes crude oil. As a key economic input, crude oil is more than just a tradable asset. Crude oil is an excellent indicator for the economy as well as a commodity to...
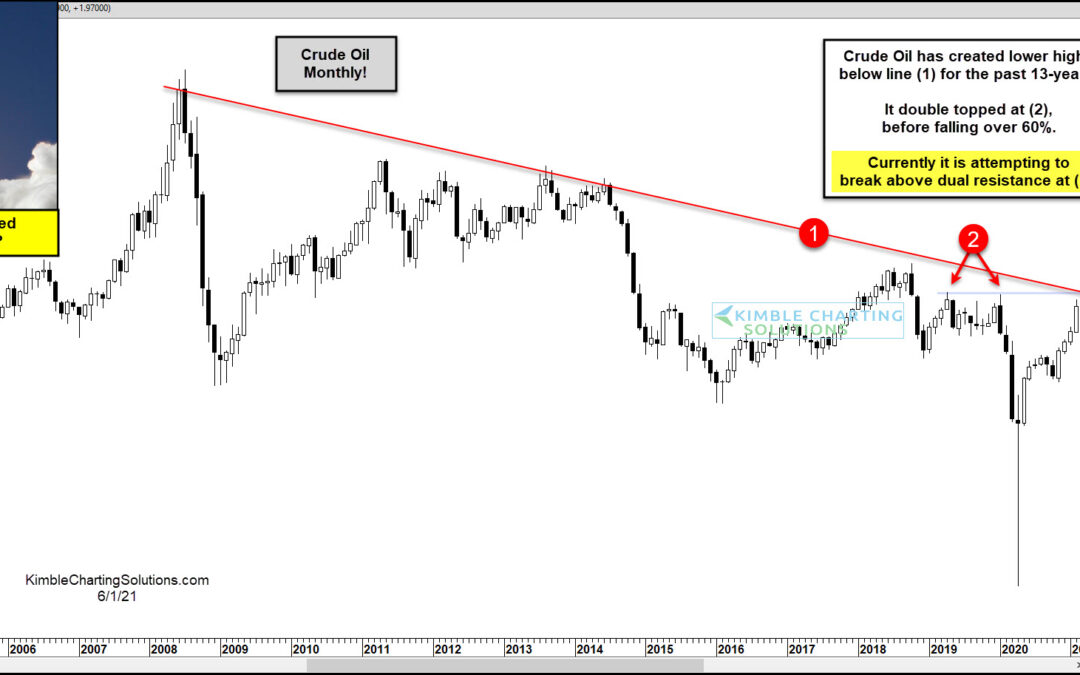
by Chris Kimble | Jun 1, 2021 | Kimble Charting
Is Crude Oil about to blast off and hit much higher prices? It might be worth being aware of what could be taking place this month in this important commodity! Crude Oil has created lower highs over the past 13-years, since peaking back in 2008, along line (1). It...
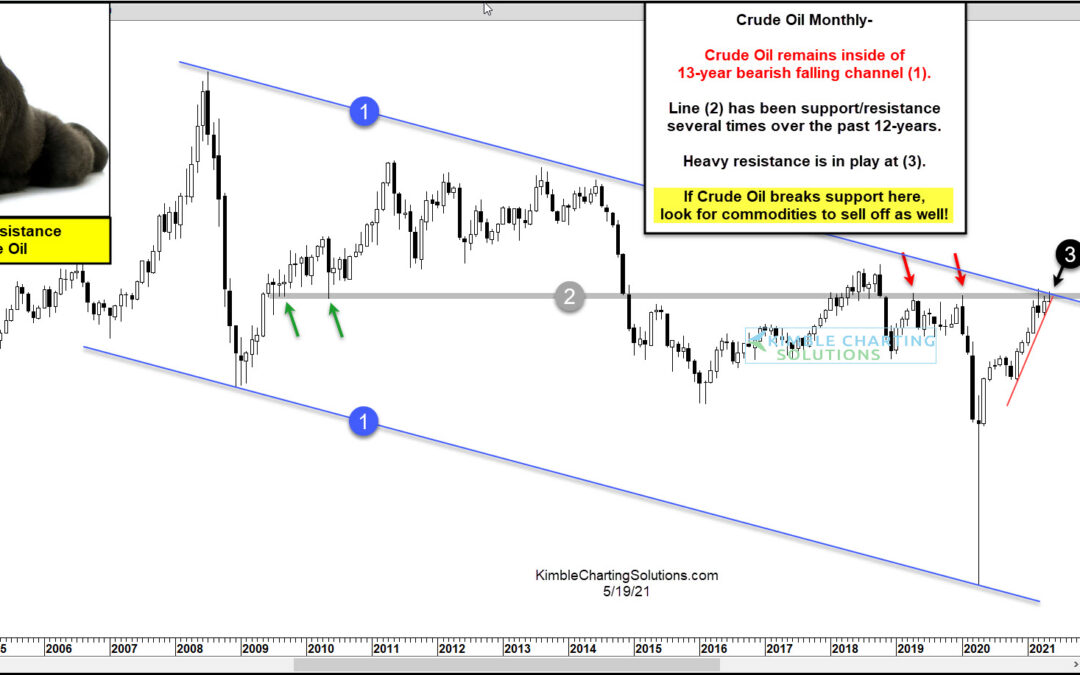
by Chris Kimble | May 20, 2021 | Kimble Charting
The past several months have seen the price of crude oil rise substantially. This isn’t all that surprising given that the economy is slowly recovering from last year’s COVID-19 shutdowns. Currently, crude oil is trading near $65. That doesn’t seem all that important…...
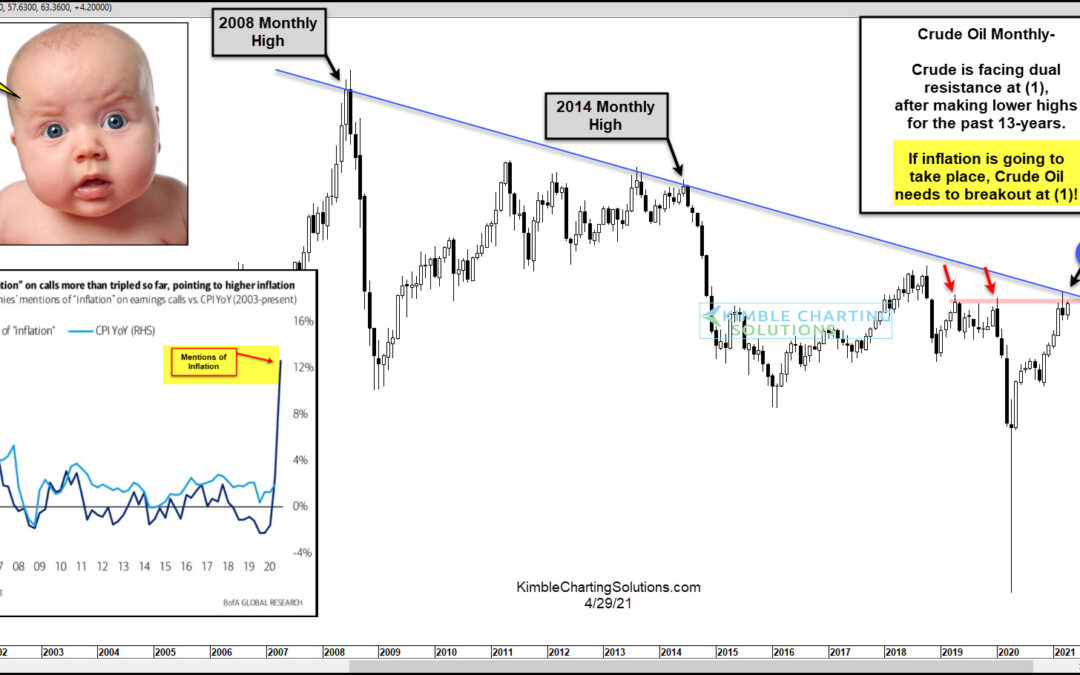
by Chris Kimble | Apr 29, 2021 | Kimble Charting
Commodities prices have risen rather sharply over the past 12-18 months, adding to worries of pricing pressure and inflation. As you can see in the chart above, businesses are taking note. The word “inflation” is being mentioned at a record rate by S&P 500...
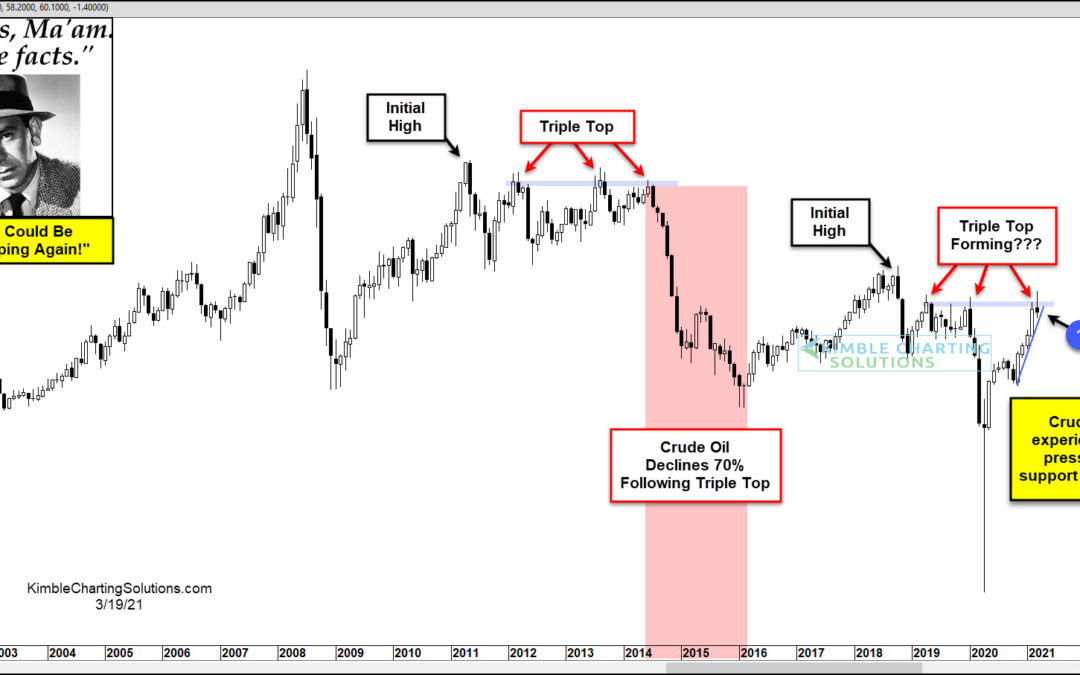
by Chris Kimble | Mar 19, 2021 | Kimble Charting
Is the stage set for Crude Oil to experience a decline of at least 50%? Possible This chart looks at Crude Oil on a monthly basis over the past 20-years. Crude oil created a Triple top over a 2-year period (2012 -2014), then selling pressure drove it down nearly 70%...
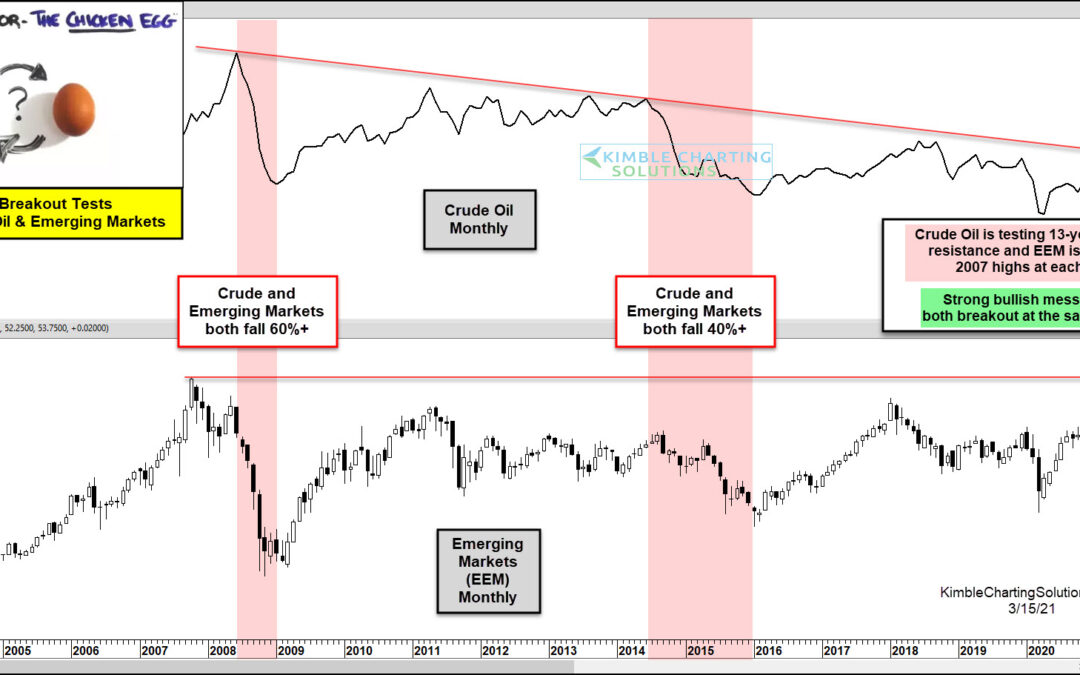
by Chris Kimble | Mar 15, 2021 | Kimble Charting
Crude Oil and Emerging Markets have experienced several important highs and lows near the same time over the past 20-years. Both peaked at the same time in 2008 and each declined over 60%. They both peaked again in 2014 and declined over 40% each. Crude oil is testing...
