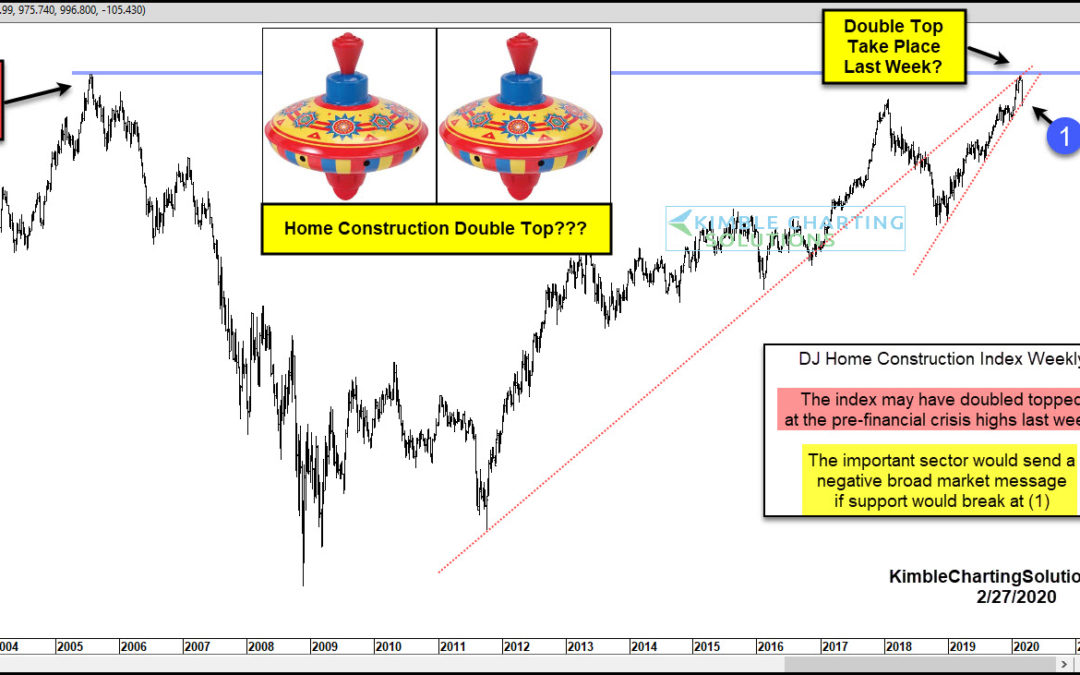
by Chris Kimble | Feb 28, 2020 | Kimble Charting
Most of us remember the 2007-2009 financial crisis because of the collapse in home prices and its effect on the economy. One key sector that tipped off that crisis was the home builders. The home builders are an integral piece to our economy and often signal “all...
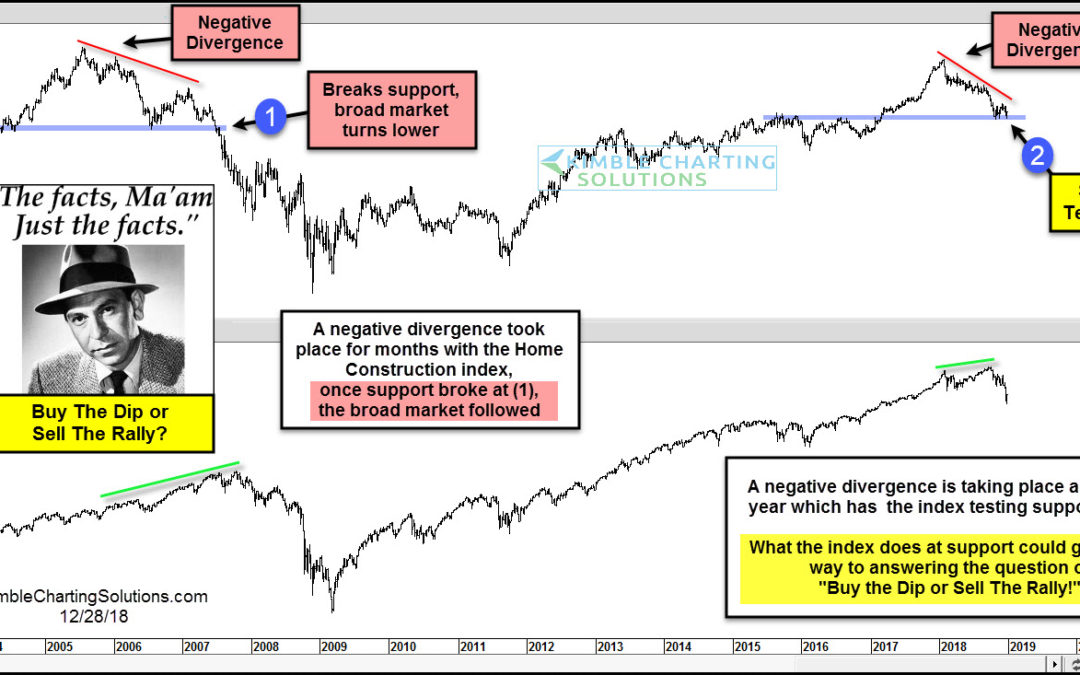
by Chris Kimble | Dec 28, 2018 | Kimble Charting
Any large decline in stocks often brings up the question, should one start buying the dips or selling rallies. The decline of late and the bounce higher the past few days most likely have millions of investors around the world pondering this very question. This chart...
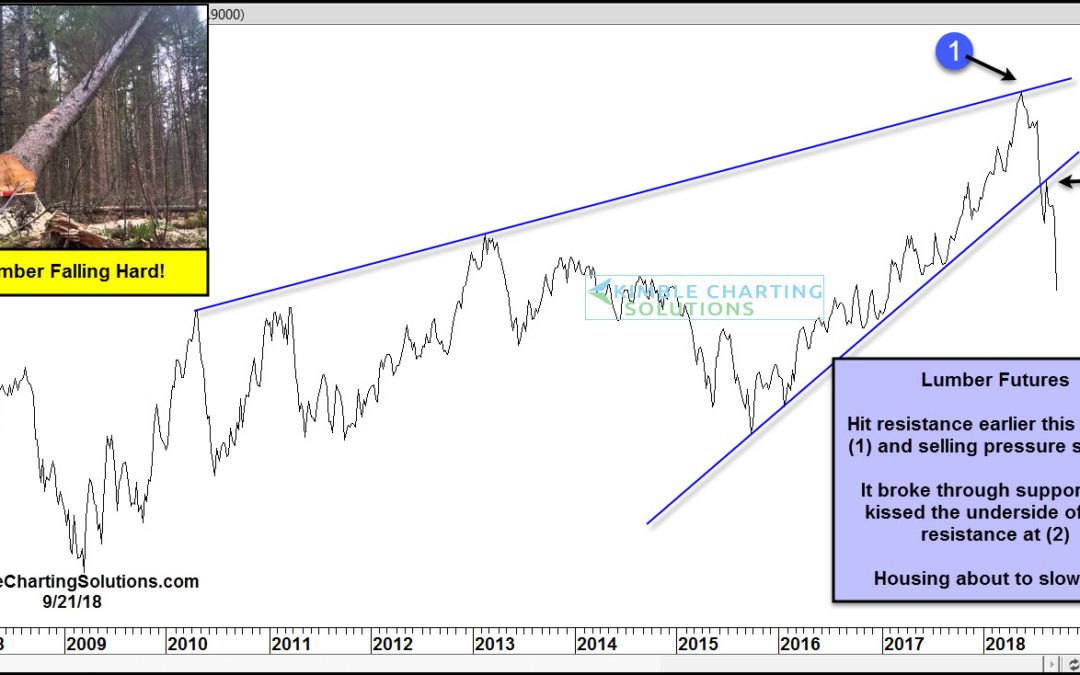
by Chris Kimble | Sep 24, 2018 | Kimble Charting
CLICK ON CHART TO ENLARGE Home and Lumber prices can send important messages to how the economy is doing. The chart above looks at Lumber prices over the past 11-years. So far this year, Lumber and the DJ Home Construction index is diverging against the broad market....

by Chris Kimble | Sep 11, 2014 | Kimble Charting
CLICK ON CHART TO ENLARGE Almost four years ago the Power of the Pattern shared that a falling resistance line breakout would be good for home builders ETF XHB (see post here). Since the posting XHB is up almost 100%. Despite the S&P 500 doing well since...
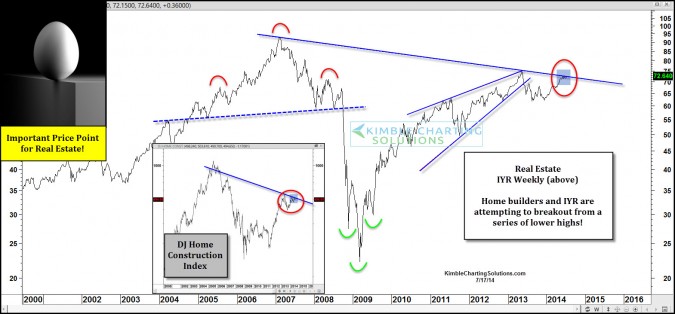
by Chris Kimble | Jul 17, 2014 | Kimble Charting
CLICK ON CHART TO ENLARGE Real Estate ETF (IYR) is up almost three times as much as the S&P 500 Year-to-date. This rally has taken IYR up to a falling resistance line, drawn off the 2006 highs. The DJ Home Construction Index is rather soft today...

by Chris Kimble | Aug 13, 2013 | Kimble Charting
CLICK ON CHART TO ENLARGE Home builders and Real Estate (IYR) gave an early signal to some up coming economic and broad stock market weakness back in 2006 & 2007. Of late Home builders and IYR are sinking in price, breaking lower below support of large bearish...
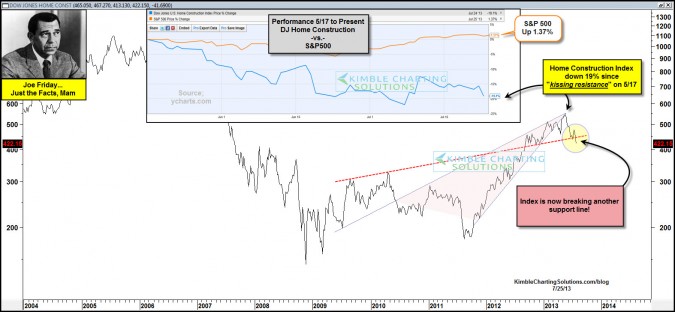
by Chris Kimble | Jul 26, 2013 | Kimble Charting
CLICK ON CHART TO ENLARGE After creating a bearish rising wedge, the DJ Home Construction index broke support and then rallied to……… kiss underside of the old support as resistance on 5/17. Results since the kiss of resistance….A 19% decline in...
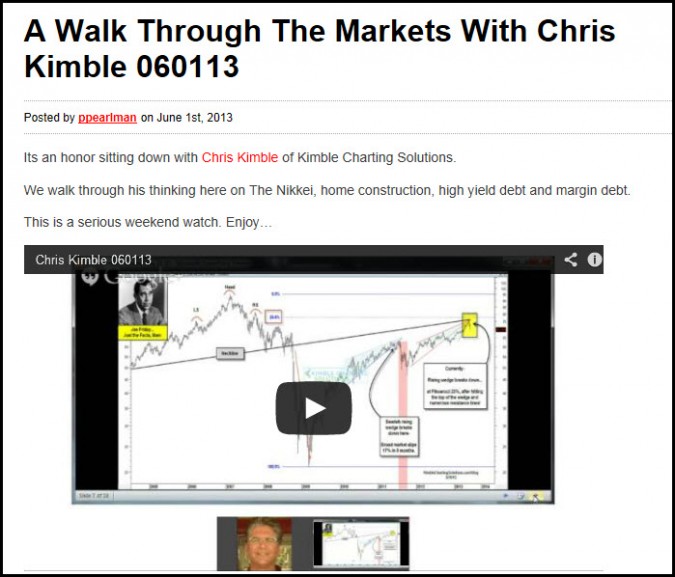
by Chris Kimble | Jun 1, 2013 | Kimble Charting
CLICK HERE TO WATCH INTERVIEW We discuss why we are shorting the Nikkei (EWV up 20% in 8 Days), what message Lumber and home builders is sending, Double top in the NYSE with margin debt in the danger zone, new Eiffel Tower patterns forming and break downs in Kimble...
