by Chris Kimble | May 31, 2013 | Kimble Charting
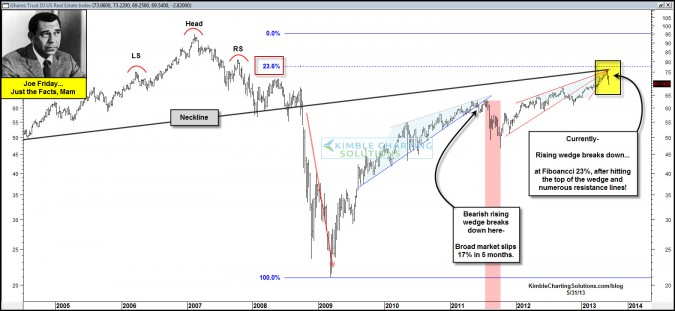
CLICK ON CHART TO ENLARGE It would be an understatement to say Real Estate is important to any economy. DJ Home Builders formed a bearish pattern back in 2007, then broke support and this index and the broad markets fell hard. The last decline of 15%+ in the S&P...
by Chris Kimble | May 1, 2013 | Kimble Charting
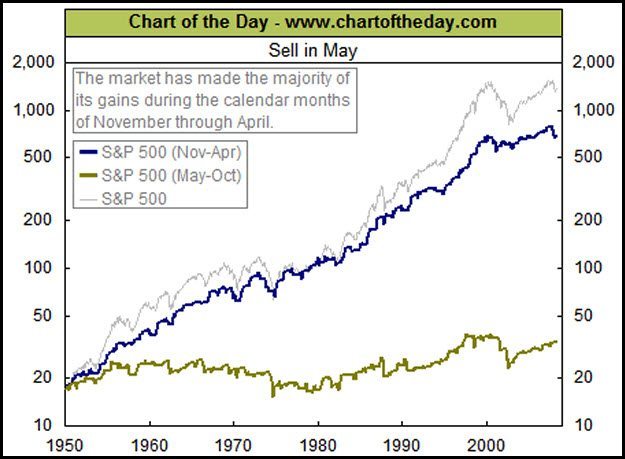
Happy May Day! This time of year causes Wall Street to bring up the “Sell in May and go away” investment strategy. This strategy suggests that the majority of the gains in the S&P500 take place between October and May of each year. CLICK ON...

by Chris Kimble | Apr 16, 2013 | Kimble Charting
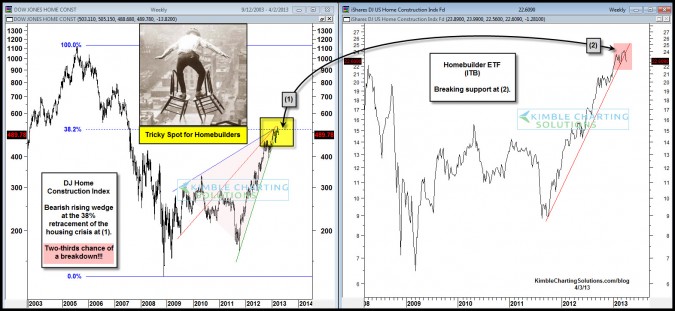
News came out this morning that Housing starts topped estimates (Housing starts here) Is this news already built into prices? Can this good news overpower the pattern below? CLICK ON CHART TO ENLARGE The DJ Home Construction index declined almost 90%...
by Chris Kimble | Apr 11, 2013 | Kimble Charting
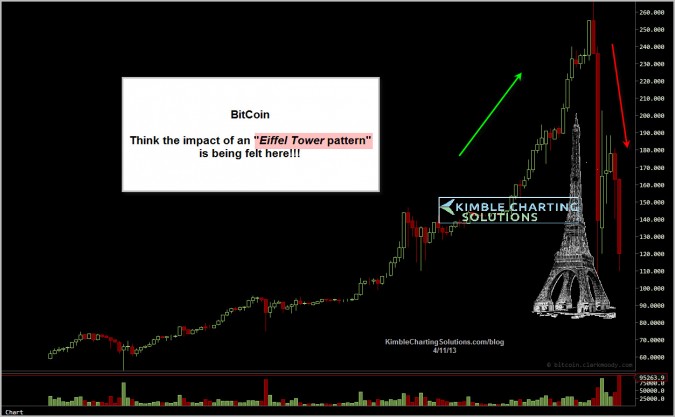
CLICK ON CHART TO ENLARGE The impact of an Eiffel Tower pattern is this….if you see the left side of the Eiffel tower, you often will experience the right side too! Bitcoin has fallen 50% in a few days!!! These pattern suggest investors sell on a support break...
by Chris Kimble | Apr 3, 2013 | Kimble Charting
CLICK ON CHART TO ENLARGE Housing took the economy and the broad markets down back in 2006-2009. The DJ Home Construction index has created a multi-year bearish rising wedge pattern, with the apex of the pattern at its 38% Fibonacci retracement level at (1) above....

by Chris Kimble | Feb 20, 2013 | Kimble Charting
CLICK ON CHART TO ENLARGE What sector had a major impact on the economy and stock market from 2006 to 2009? Home Construction Index… as it fell 90% in price in a few years. What sector has been very hot of late and might have helped pull the broad...

by Chris Kimble | Oct 2, 2012 | Kimble Charting
CLICK ON CHART TO ENLARGE Shared this chart with Premium and Sector Sentiment Members last week. The 2-pack reflects that the DJ Home construction index is up against a couple of resistance lines, a Fibonacci extension level at (1) and the relative momentum index is...
by Chris Kimble | Sep 26, 2012 | Kimble Charting
CLICK ON CHART TO ENLARGE The DJ Home Construction Index has been “HOT” over the past year, outperforming the S&P 500 by 60%. The rally now has this important index touching a couple of resistance lines and a Fibonacci Extension level at the same...
