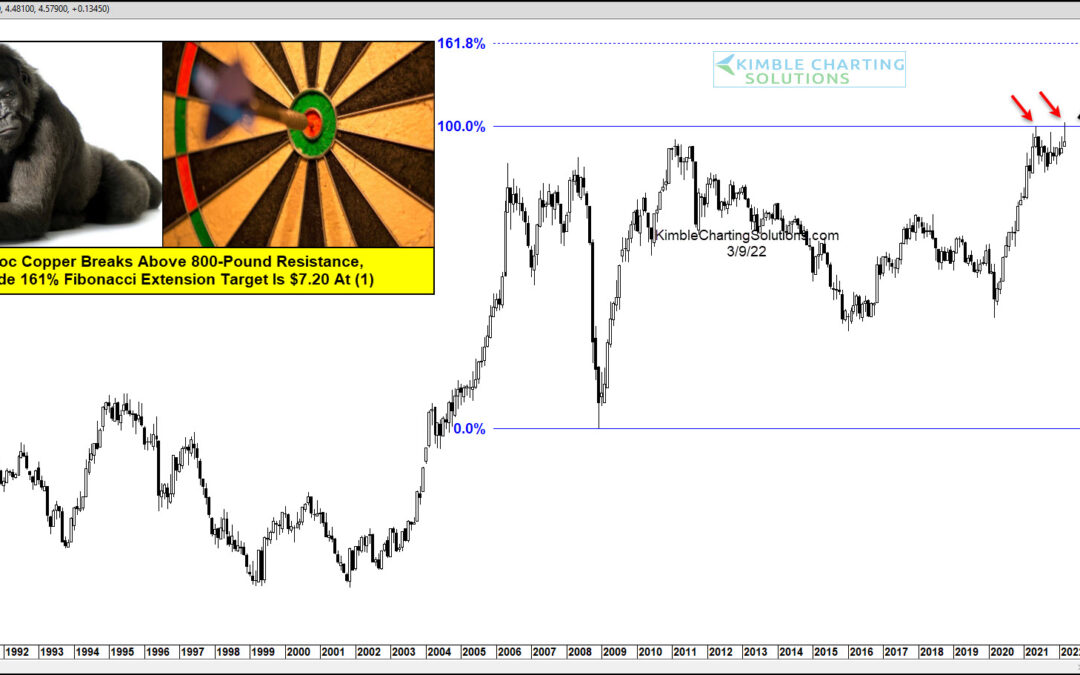
by Chris Kimble | Mar 10, 2022 | Kimble Charting
Copper prices have been running hot ever since the onset of COVID. Sound familiar? Yep, because it’s happened across several commodities. Things are rough right now on the inflation front… but could it get worse before it gets better? Today we look at the long-term...
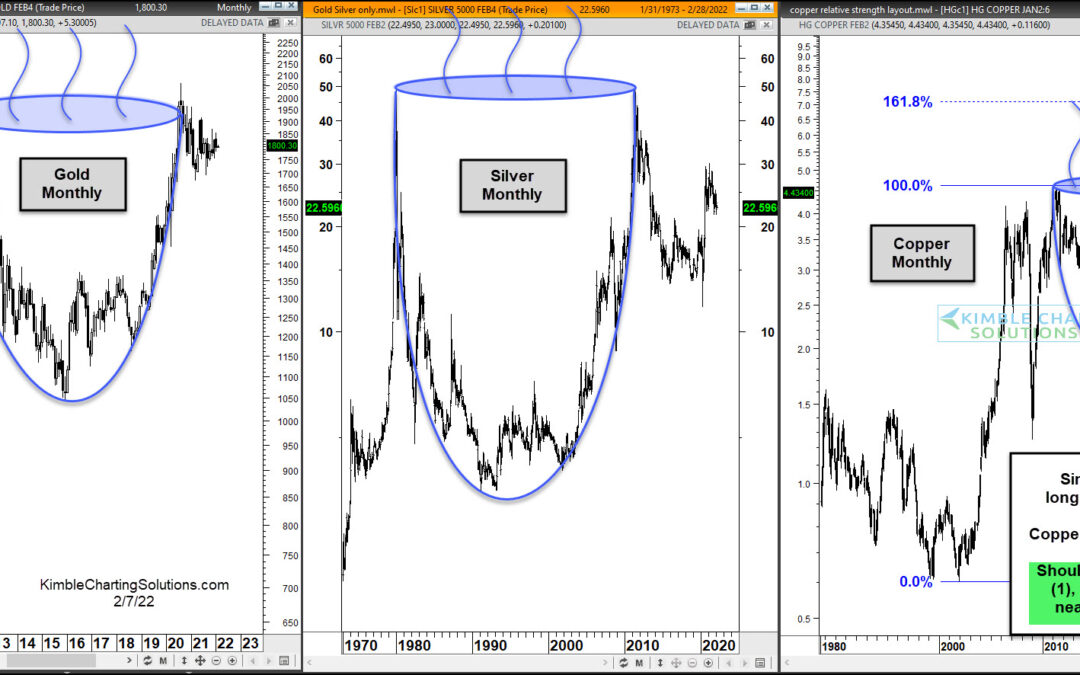
by Chris Kimble | Feb 8, 2022 | Kimble Charting
Each investor has to be aware of what their time-frame is. Are we looking at the coming days, weeks, months, or years. Some are traders and some are more active than others. Timeframes are particularly important right now for precious metals. Especially over the...
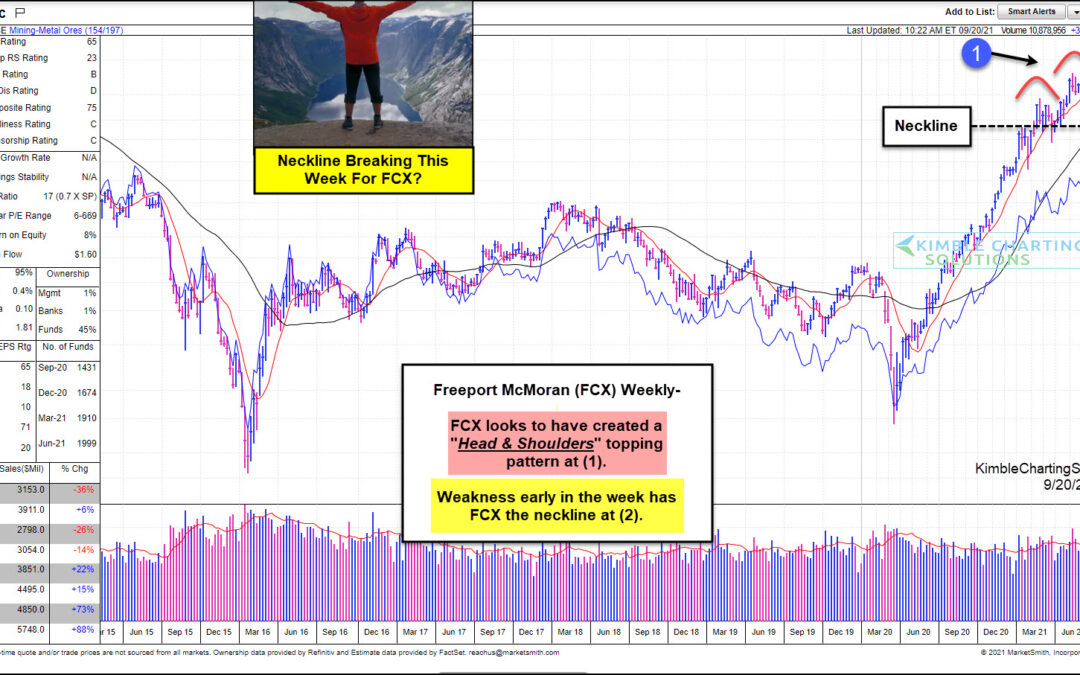
by Chris Kimble | Sep 22, 2021 | Kimble Charting
Copper and Gold miner Freeport McMoRan (FCX) is in the middle of all things metals. And the economy. As the economy heats up, copper prices tend to follow. And if interest rates and / or inflation ticks higher, Gold tends to follow. Over the past 18 months, Freeport...
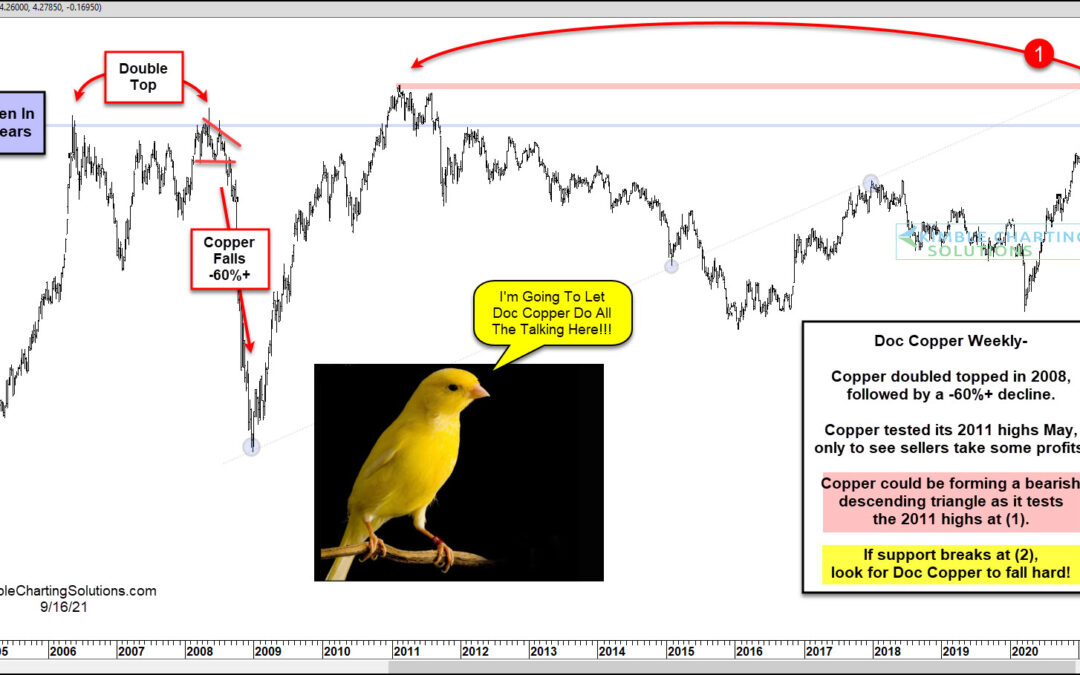
by Chris Kimble | Sep 20, 2021 | Kimble Charting
When Doc Copper speaks, investors should listen. And it may be that time again. The price of copper broke above the $4 mark early this year… but it’s struggled to maintain its momentum and is in a multi-month pullback. Today’s chart is a “weekly” chart of Copper. And...
by Chris Kimble | Jul 28, 2021 | Kimble Charting
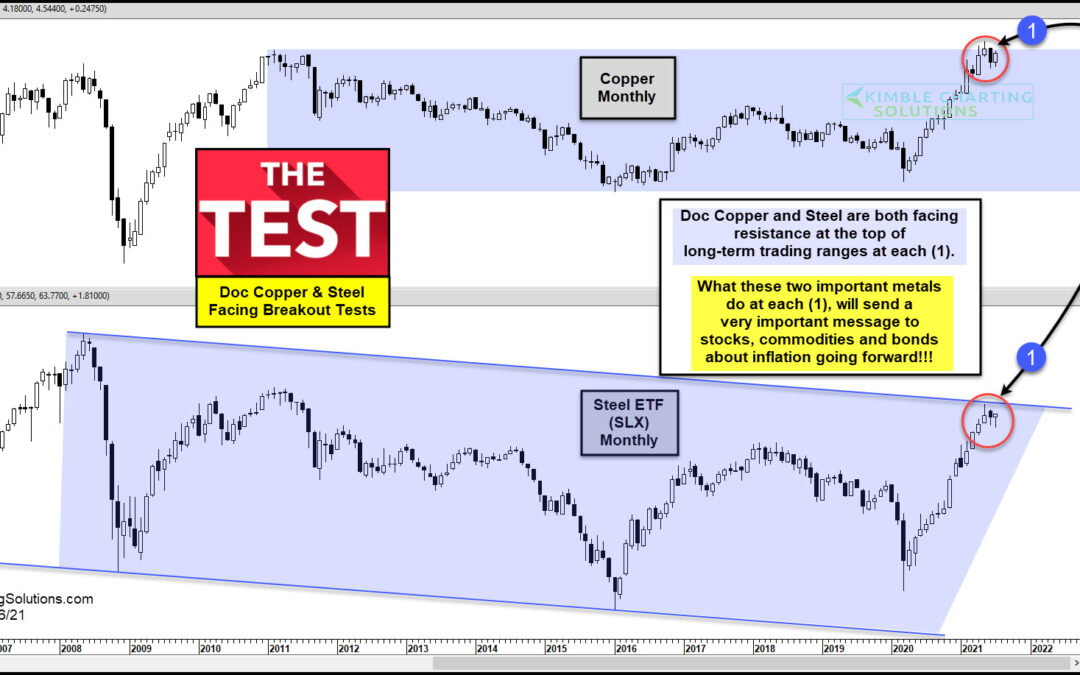
Just as the economic recovery is picking up steam, there are mixed messages coming from inflation data as well as the equities (breadth) and bonds markets (yields). Enter the commodities market… here we can find several key economic inputs that are elevated, and some...
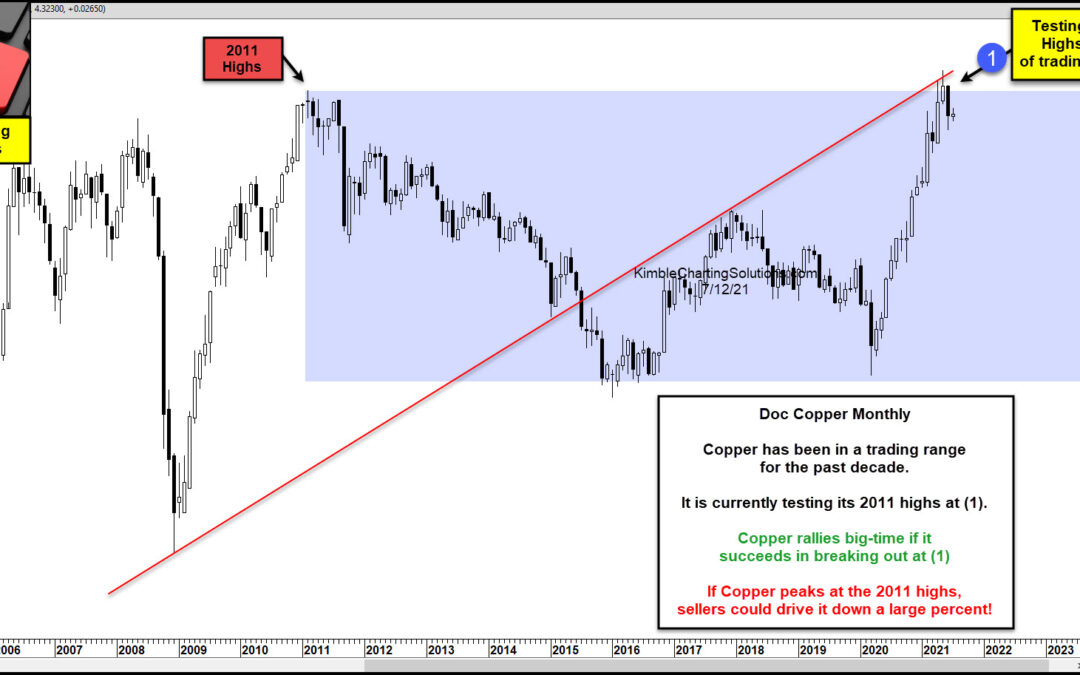
by Chris Kimble | Jul 14, 2021 | Kimble Charting
The price of Copper continues to be an indicator for the economic recovery, as well as emerging inflationary concerns. We’ve seen Copper prices rip higher over the past several months (similar to 2009/2010). On one hand, this is signaling (and underscoring) the...

by Chris Kimble | May 21, 2021 | Kimble Charting
The price of copper has long been a bellwether indicator of the U.S. economy. Rising copper prices signified economic growth (industry) and often tied to interest rates and potential inflation. That said, globalization, deflationary forces (the rise of technology),...
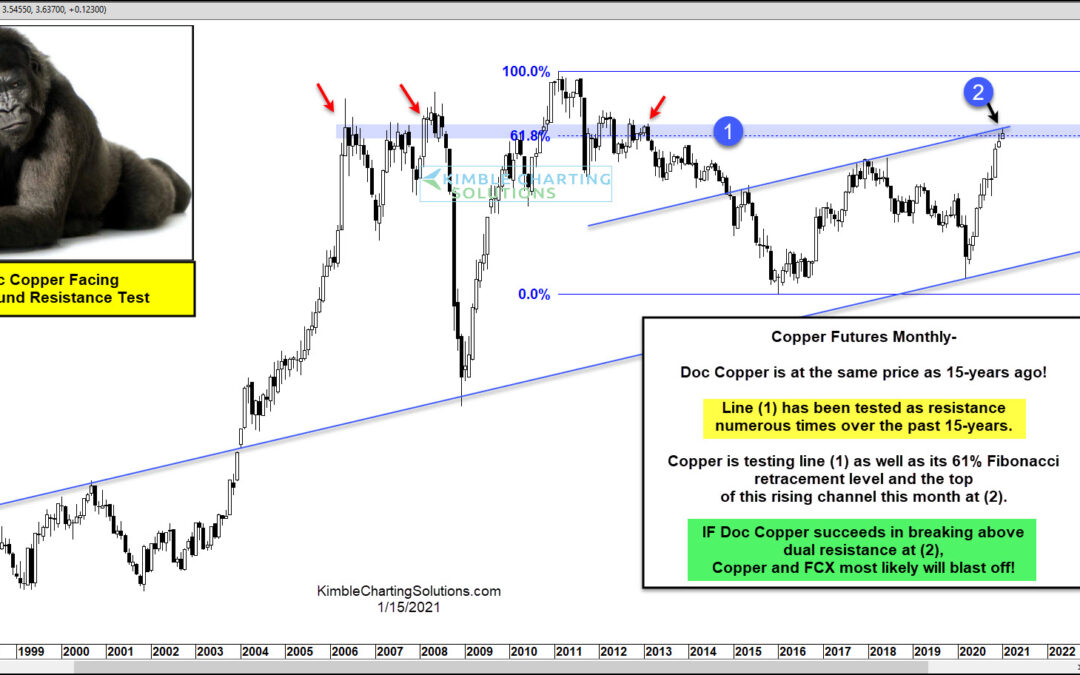
by Chris Kimble | Jan 15, 2021 | Kimble Charting
The broader commodities market is enjoying a multi-month rally that has seen momentum carry over into early 2021. One area of commodities that’s seen a big lift is the metals space. We hear a lot about gold and silver, but how about copper? One look at today’s chart...
