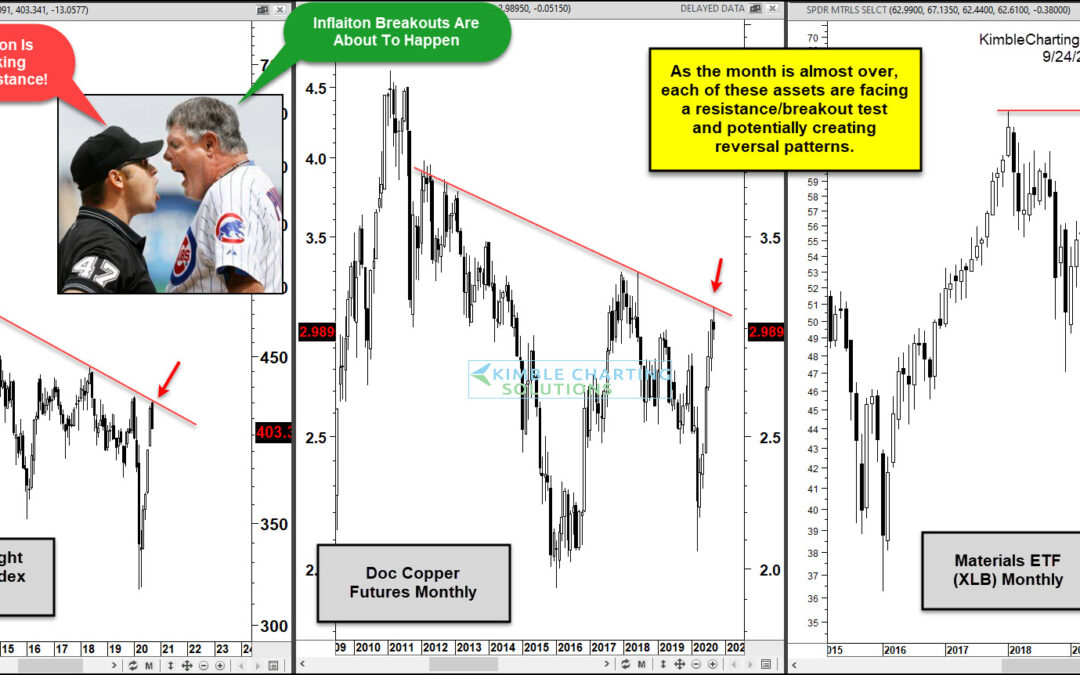
by Chris Kimble | Sep 24, 2020 | Kimble Charting
Inflation has long been a word that the Federal Reserve uses but the general markets have forgotten about. Why? Well because it’s been virtually non-existent for years. Key indicators like commodities (i.e. copper) have been in a down-trends and the Materials Sector...
by Chris Kimble | Aug 27, 2020 | Kimble Charting
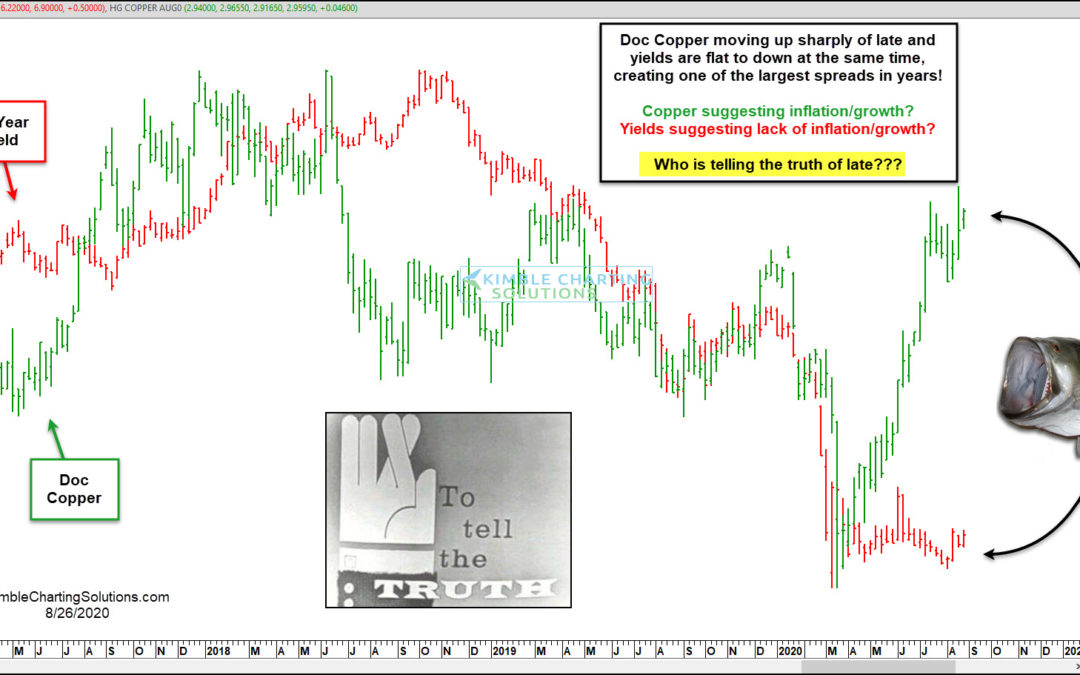
A good deal of the time, Doc Copper and Yields tend to move in the same direction. Of late, something strange is taking place! This chart looks at Doc Copper (Green) and the Yield on the 10-year note (Red). Both headed sharply lower and bottomed together in March of...
by Chris Kimble | Aug 11, 2020 | Kimble Charting
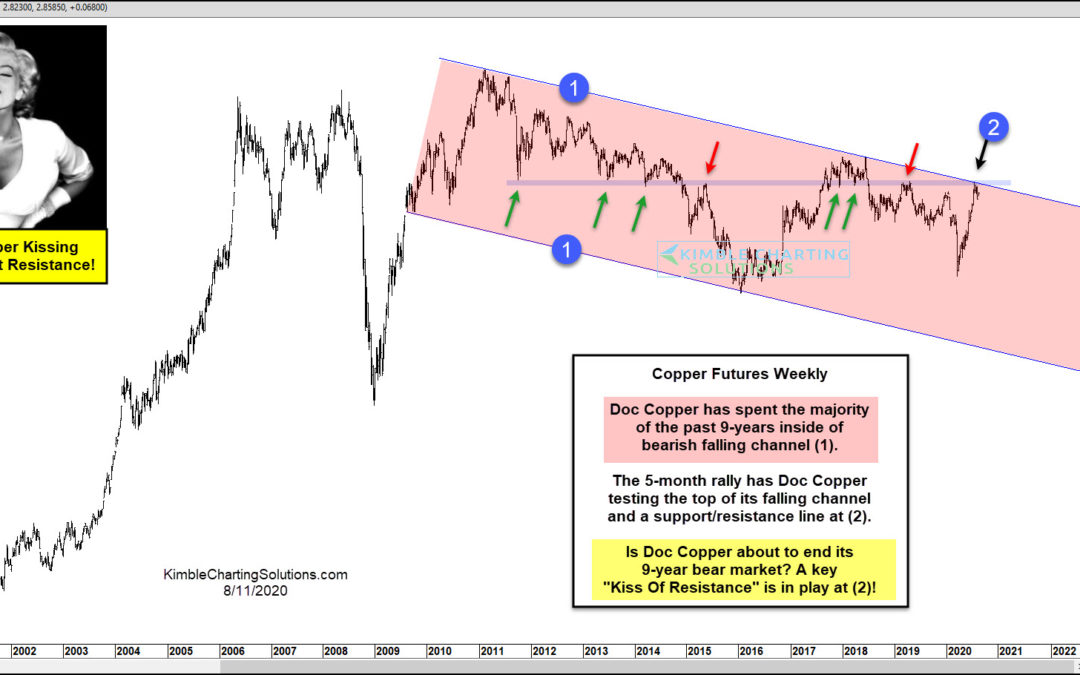
Is ole Doc Copper about to ends its 9-year bear market? I suspect we will find out the answer to the question very soon! Doc Copper has created a series of higher lows inside the falling channel (1) since it peaked back in 2011. The rally from the lows in March of...
by Chris Kimble | May 22, 2020 | Kimble Charting
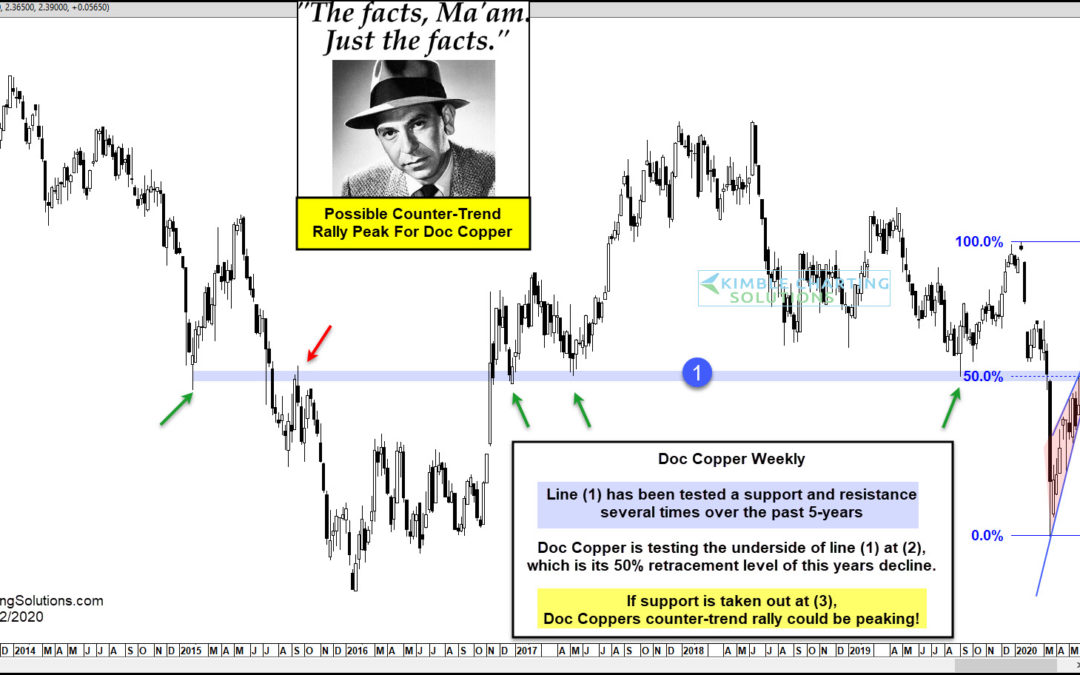
Could ole Doc Copper be sending an important message about the overall health of the global economy and the stock market in the next couple of weeks? It appears it could! This chart looks at Copper futures on a weekly basis over the past 7-years. Doc Copper looks to...
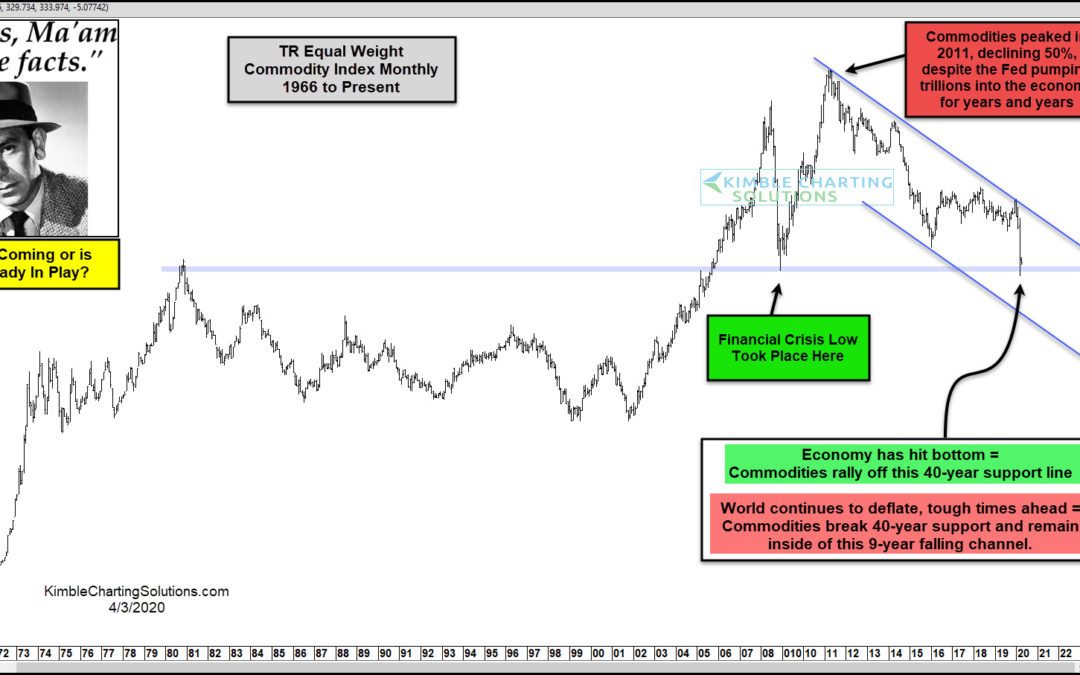
by Chris Kimble | Apr 3, 2020 | Kimble Charting
Are we headed towards a Depression or is the worst already behind us? In today’s world, comparisons to the great depression are easy to find. Are the Depression concerns well founded or are the declines of late already pricing in a bottom? In my humble opinion,...
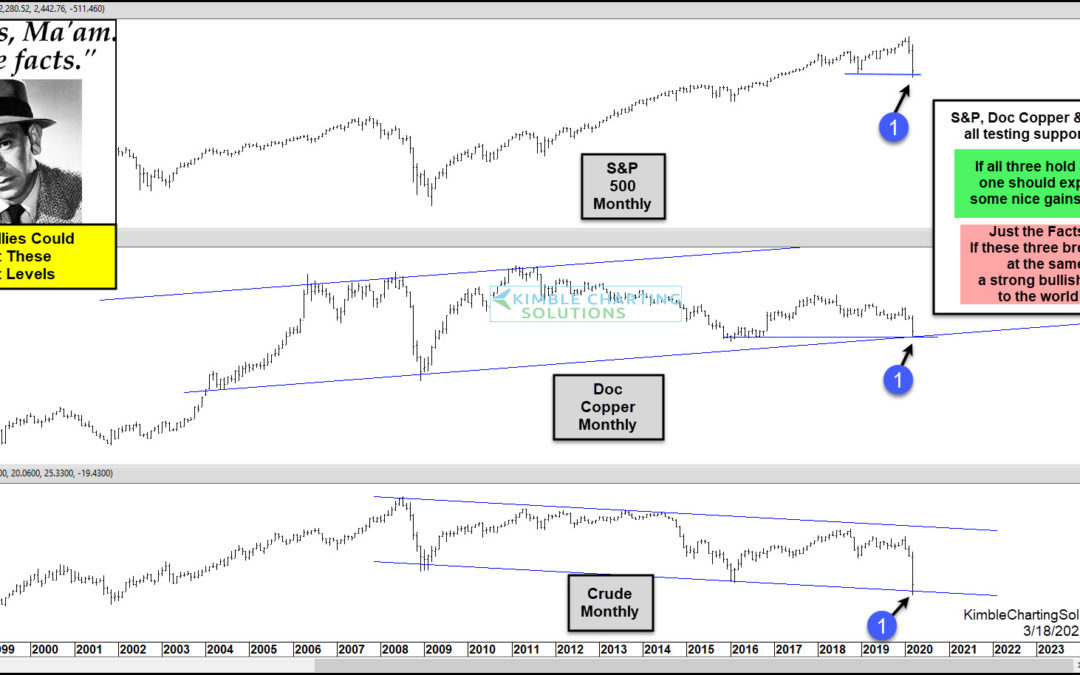
by Chris Kimble | Mar 20, 2020 | Kimble Charting
The past couple of months has delivered a lot of bad news for investors. Several key ingredients to a healthy bull market have fallen sharply, including stocks, Doc Copper, and Crude Oil. In fact, all 3 have entered bear market territory in 2020. For the year, the...
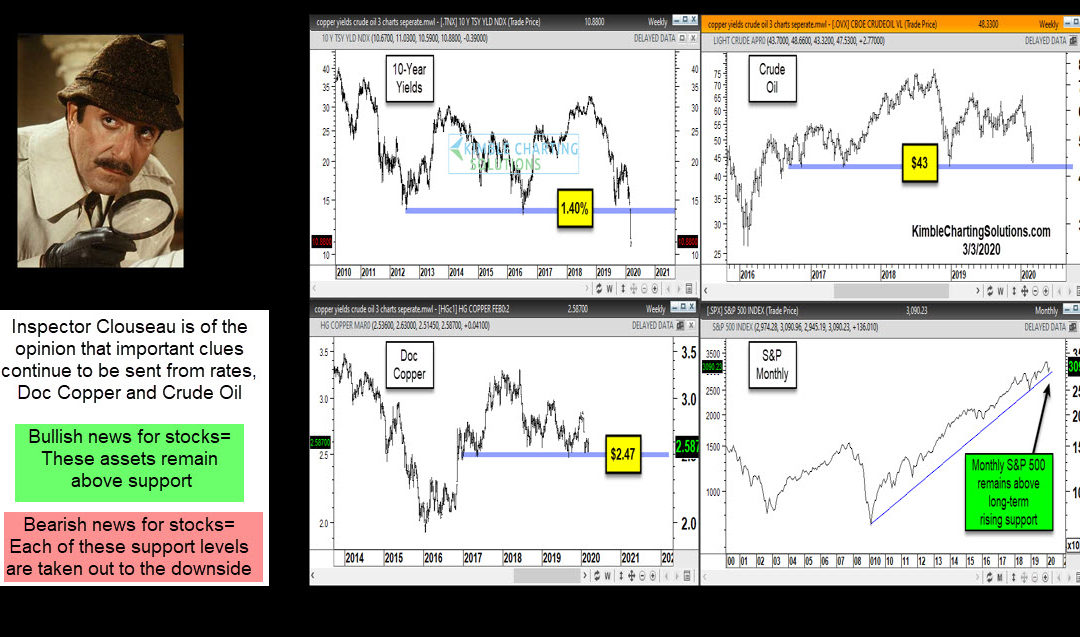
by Chris Kimble | Mar 3, 2020 | Kimble Charting
Will the economy experience a “Demand Shock?” Consumers stay at home and don’t buy many items. Will the economy experience a “Supply Shock?” Workers stay home and don’t create many products. Will a combo of both take place or...
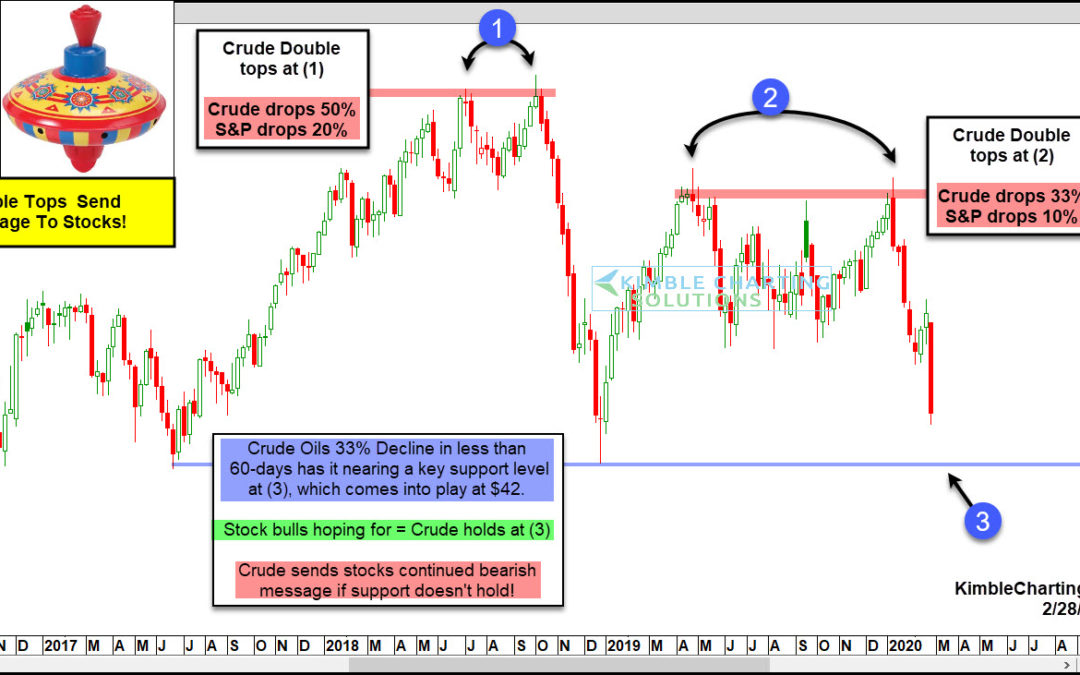
by Chris Kimble | Feb 28, 2020 | Kimble Charting
Crude Oil created its second top back in October of 2018 at (1) and then it proceeded to decline nearly 50%! What did the S&P do while Crude declined 50%, it fell nearly 20% in less than 90-days! The above chart was shared on 1//8/2000, suggesting that Crude Oil...
