by Chris Kimble | Nov 18, 2019 | Kimble Charting
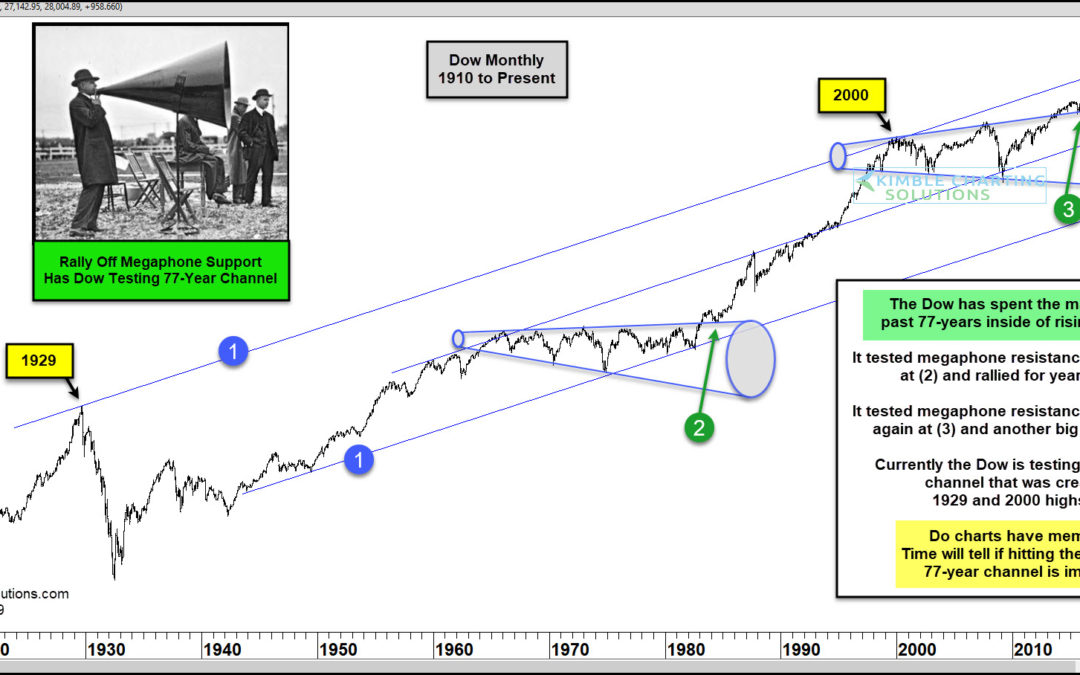
I’ve heard many times over the past 39-years I’ve been in the financial services business that charts have memories? Is it true they do? Is it possible that they have very long-term memories? This theory looks to be put to a big test by the chart above,...
by Chris Kimble | Jul 31, 2019 | Kimble Charting
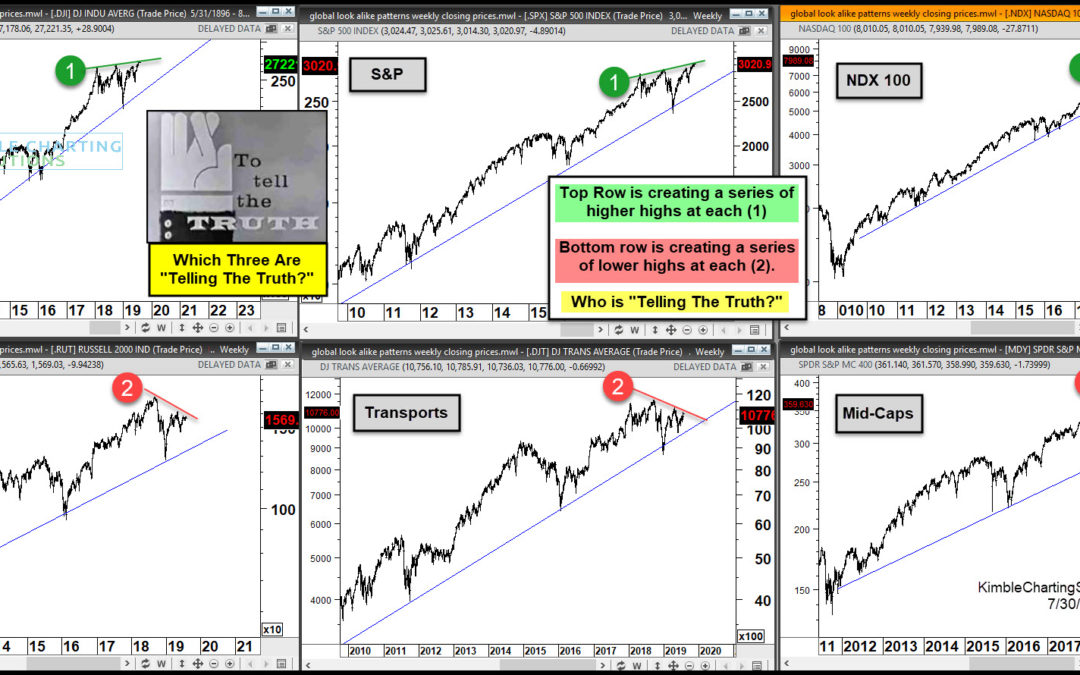
As investors prepare for the Federal Reserve announcement today, they are feeling pretty good. That’s mostly due to the performance of the “big 3” stock market indexes: the S&P 500 IndexINDEXSP: .INX, Dow Jones IndustrialsINDEXDJX: DJI, and the NasdaqINDEXNASDAQ:...
by Chris Kimble | May 15, 2019 | Kimble Charting
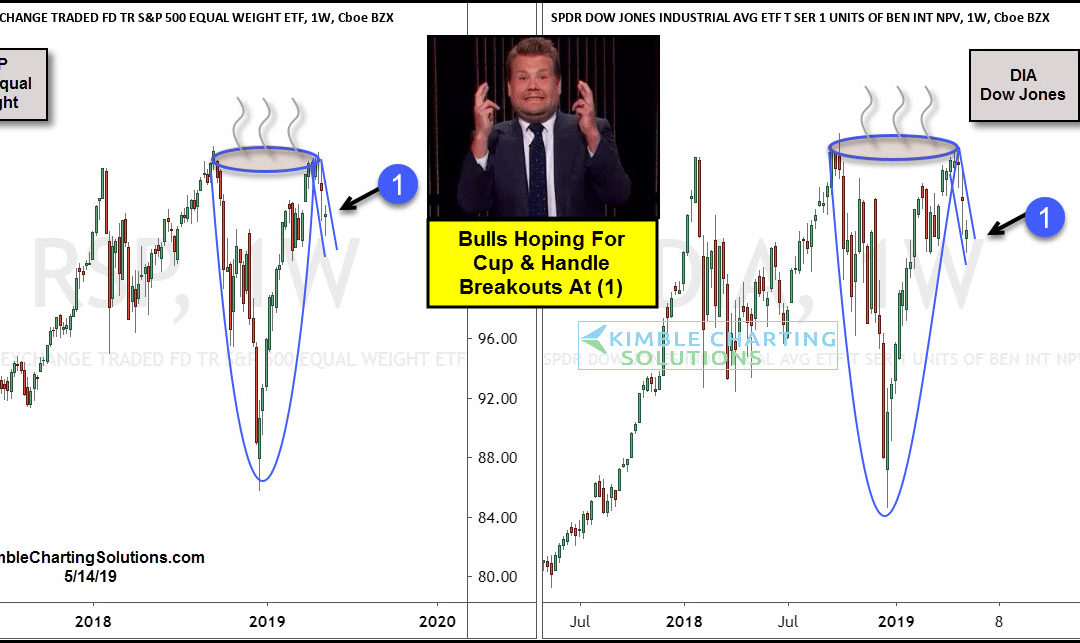
Are the S&P and Dow forming positive “Cup & Handle” patterns over the past 8-months? Bulls sure hope so! A cup and handle price pattern is a technical indicator that resembles a cup and handle where the cup is in the shape of a “U” and...
by Chris Kimble | May 10, 2019 | Kimble Charting
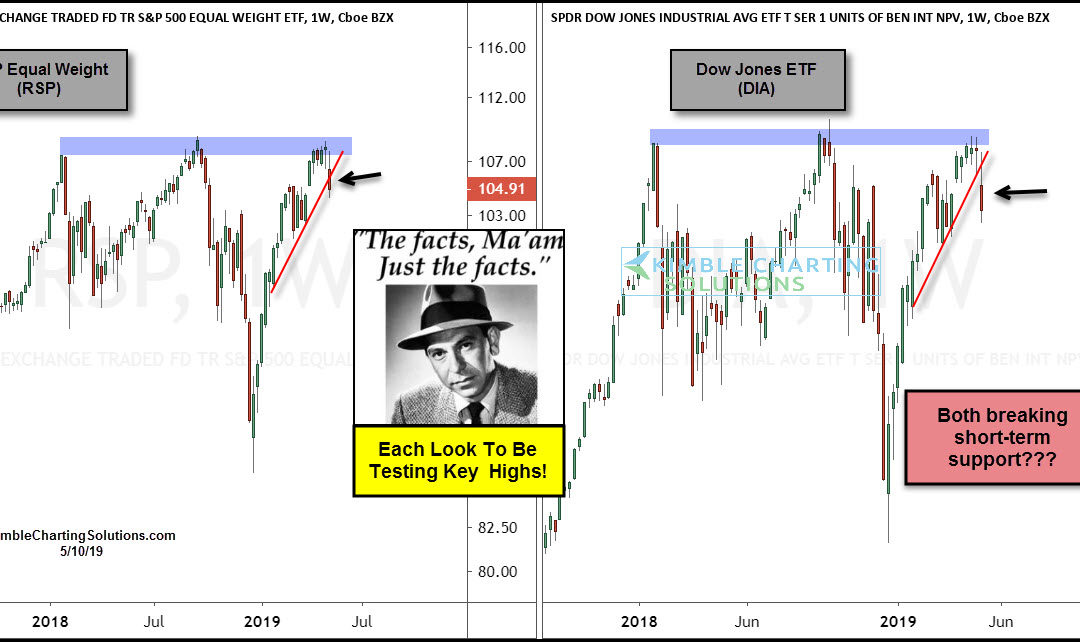
Could the Dow and the S&P both be triple topping at the same time? Possible says Joe Friday This 2-pack looks at the Dow ETF (DIA) and the Equal Weight S&P ETF (SPY) over the past 18-months. Joe Friday Just The Facts Ma’am- Each could be triple topping...

by Chris Kimble | Feb 13, 2019 | Kimble Charting
Is today the day that four important indices all break above their 200-day moving averages at the same time? Possible! This 4-pack applies 200-day moving averages to the Dow, S&P 500, QQQ and the Transports. The short-term counter-trend rallies since the lows on...
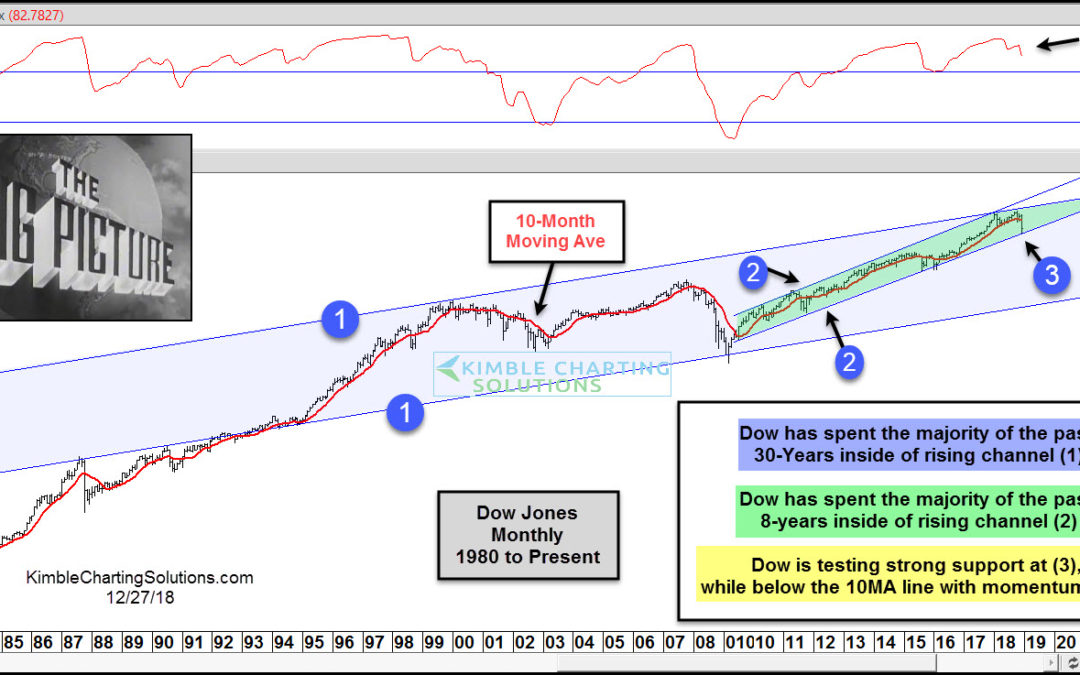
by Chris Kimble | Dec 27, 2018 | Kimble Charting
Whether the Dow is down nearly 20% from the highs of a few months ago or it experiences a 1,000 point rally, what should one do to give proper perspective to these big price moves we’ve experienced of late? In my humble opinion, the best thing to do is look at...
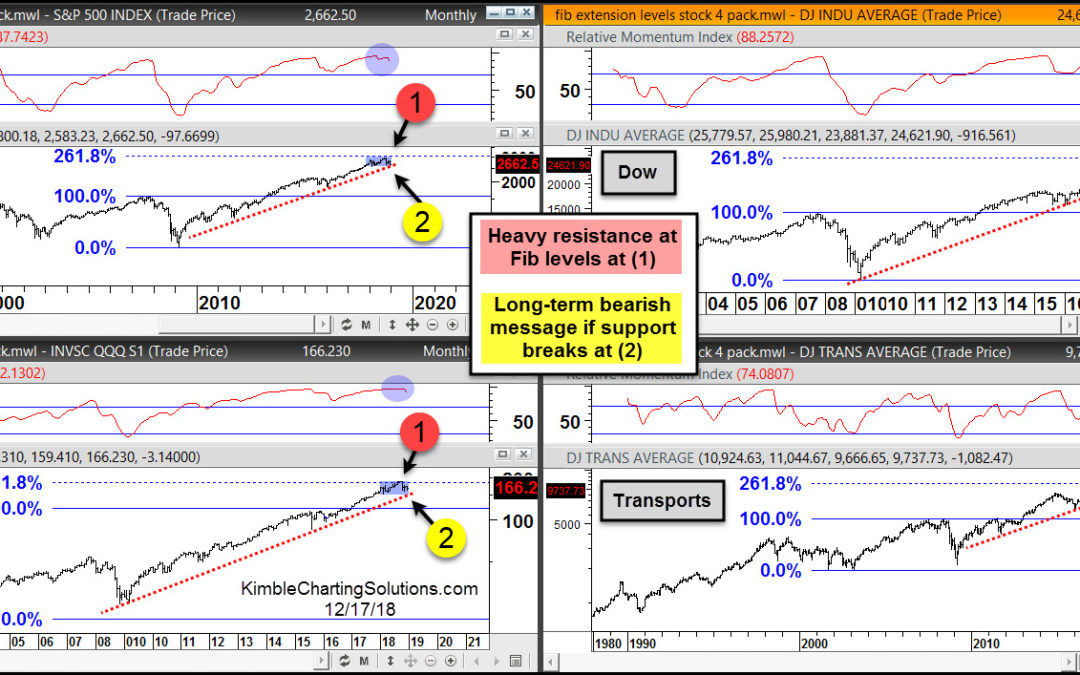
by Chris Kimble | Dec 17, 2018 | Kimble Charting
Even though stocks have been weak of late, breaks of certain price levels could actually trigger much more selling than stocks have seen so far. This 4-pack applies Fibonacci extension levels to the S&P 500, Dow, Nasdaq 100 and Transports. Each of these indices...

by Chris Kimble | Oct 26, 2018 | Kimble Charting
CLICK ON CHART TO ENLARGE Could the yield on the 2-year note send important messages about the future direction of stocks? They have in the past and they could again! The top chart looks at the yield on the 2-year note over the past 37-years. When the 2-year yield hit...
