by Chris Kimble | Oct 30, 2018 | Kimble Charting
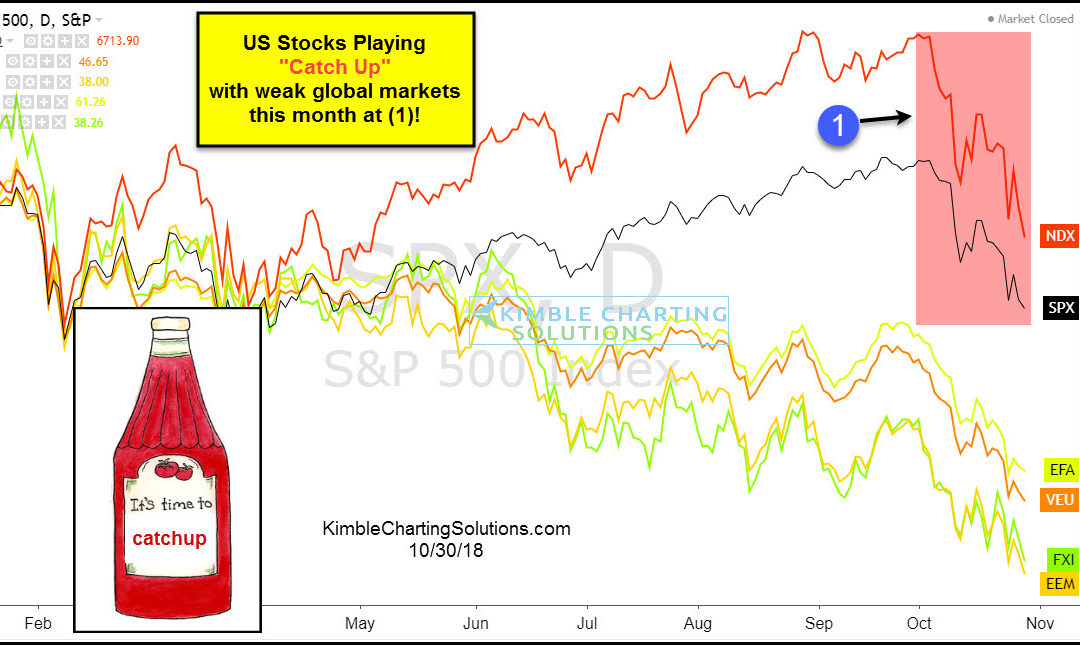
CLICK ON CHART TO ENLARGE Numerous global stocks indices peaked in January as they started creating a series of lower highs and lower lows. While a good deal of global stocks were heading south, major indices in the states continued higher. This divergence created...
by Chris Kimble | Sep 26, 2018 | Kimble Charting
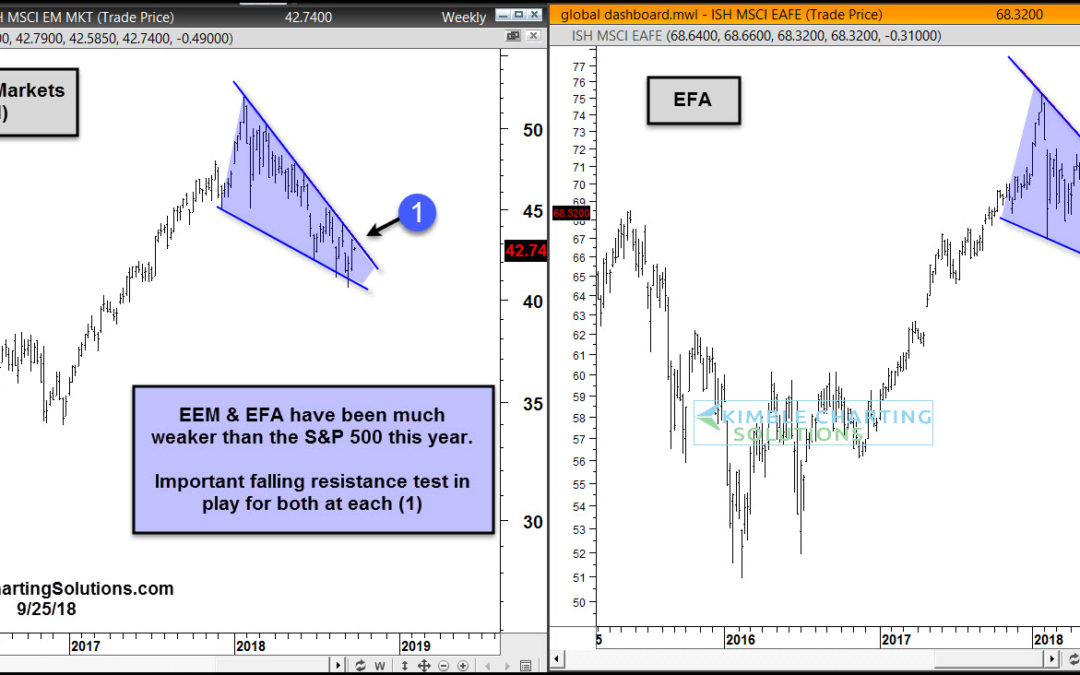
While most global stocks topped at the beginning of 2018, some markets recovered… and some did not. For instance, the major U.S. stock market indexes have fought back to make new highs, while Emerging Markets and Developed markets outside the U.S. continued to...

by Chris Kimble | Feb 13, 2018 | Kimble Charting
Some of our Financial Planning/RIA customers ask us to send them long-term moving averages on a weekly basis, because it helps them make long-term asset allocation decisions. This 6-pack was created to give perspective on a diverse set of assets. It includes...

by Chris Kimble | Oct 14, 2017 | Kimble Charting
Emerging Markets ETF (EEM) did something this week, it has been unable to do numerous times over the past 5-years. Below looks at the price pattern of EEM over the past 10-years. CLICK ON CHART TO ENLARGE EEM has done well since the start of 2016, reflecting gains...

by Chris Kimble | Oct 11, 2017 | Kimble Charting
The Nikkie index has found a certain price level very tough to break free from for the past 24-years. Below looks at the Nikkei index on a monthly basis for the past 30-years. CLICK ON CHART TO ENLARGE Line (A) comes into play around the 20,900 level. Since the early...

by Chris Kimble | Dec 15, 2014 | Kimble Charting
CLICK ON CHART TO ENLARGE EFA has been a weak performer for over a year and during the rally in the S&P 500 from 10/15 to last week, it had reflected relative weakness too. With EFA up against falling resistance, Premium Members shorted EFA by...

by Chris Kimble | Dec 9, 2014 | Kimble Charting
CLICK ON CHART TO ENLARGE EFA ETF earlier this year created a bearish descending triangle at long-term resistance and then proceeded to break support. On October the 15th, the S&P 500 hit support and reversed higher, sending to all-time highs. At the...

by Chris Kimble | Oct 7, 2014 | Kimble Charting
This morning the IMF lowered its forecast for global growth. Are they attempting to lower the bar on expectations going forward? Do they know something we don’t? Should one pay attention to forecasts or prices? CLICK ON CHART TO ENLARGE The...
