by Chris Kimble | Jun 4, 2020 | Kimble Charting
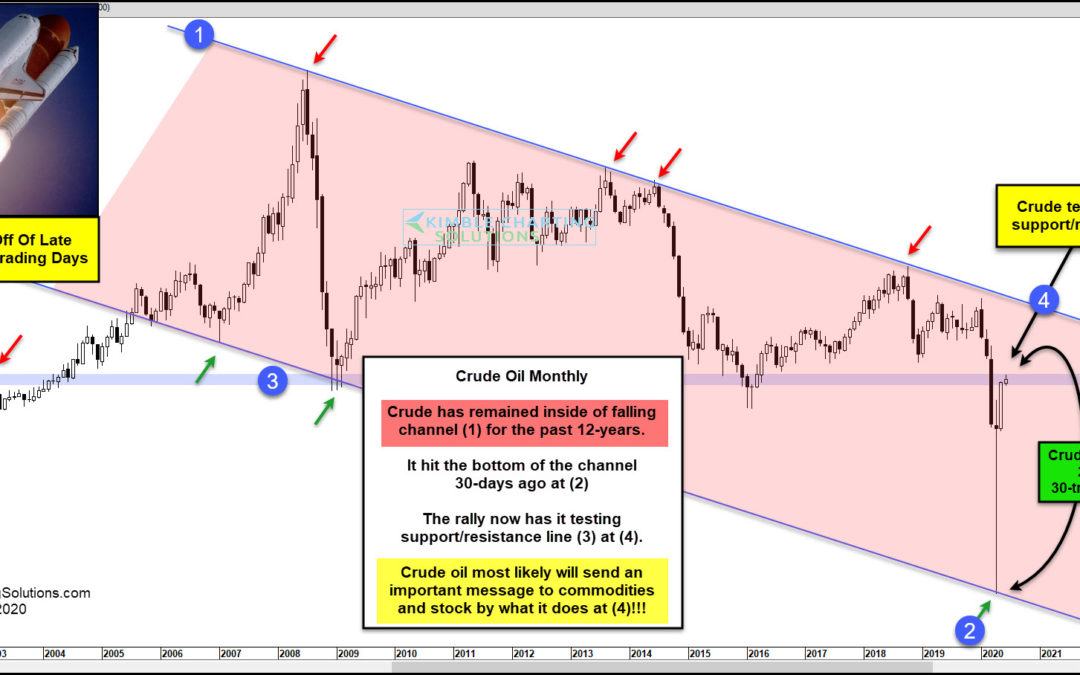
Can you believe that Crude Oil has rallied 222% in the past 30-trading days? It’s hard to believe that Crude Oil is trading nearly $75 off its lows, yet the current price is around $36! The chart looks at the Crude Oil continuous contract on a monthly basis for...

by Chris Kimble | Oct 13, 2017 | Kimble Charting
Just The Facts- Energy ETF (XLE) has lagged the S&P 500 by a large margin over the past three years, reflected in the chart below- CLICK ON CHART TO ENLARGE The chart above reflects that XLE has underperformed the S&P 500 by nearly 60% over the past three...

by Chris Kimble | Oct 2, 2017 | Kimble Charting
Crude Oil has been moving sharply higher the past few weeks. Last week we shared with Sectors Extreme & Premium members that Crude Oil had created an important pattern to finish the week while hitting an important price point. Below looks at the chart shared with...

by Chris Kimble | Sep 12, 2017 | Kimble Charting
Exxon Mobil (XOM) has little to brag about over the past 6-years, as its performance is flat and it has lagged the S&P 500’s gains by nearly 95% (See Chart Below). If one looks back 10-years, XOM hasn’t made any gains either! Could times be about to...

by Chris Kimble | Apr 10, 2017 | Kimble Charting
Crude Oil has created a series of lower highs and lower lows since the peak in 2008. Since the lows of 14-months ago, Crude has created a series of higher lows and potentially creating a bullish ascending triangle pattern. This pattern two-thirds of the time, leads to...

by Chris Kimble | Apr 5, 2017 | Kimble Charting
Energy stocks have not been a good buy and hold investment for the past few years. Looking back over the past 5-years, XLE has lagged all of the S&P 500 sectors and it is the only S&P sector that has a negative 5-year return. Could this trend be ending? A...

by Chris Kimble | Mar 30, 2017 | Kimble Charting
Below looks at the performance of the S&P 500 Sectors, looking back 5-years. The winner for the lowest performance is the Energy Sector (-1.42%). XLE is lagging the S&P 500 by almost 70%, in just 5-years. “Time for them to rally?” CLICK ON CHART TO...

by Chris Kimble | Nov 21, 2016 | Kimble Charting
Energy stocks have under performed the broad markets the past few years. Looking back over the past 5-years, XLE is up around 5%, lagging the S&P by nearly 75%. Is this under performance about to end? Below looks at XLE over the past year years. CLICK ON CHART TO...
