by Chris Kimble | Apr 15, 2015 | Kimble Charting
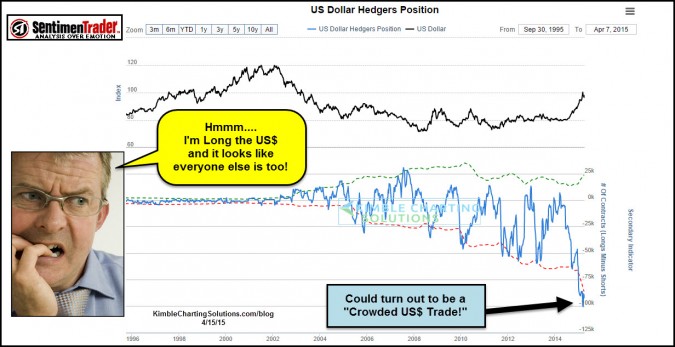
CLICK ON CHART TO ENLARGE The above chart from Sentiment Trader, reflects that a ton of investors have established long positions in the U.S. Dollar. This chart reflects that traders have established the most unique positions in the U.S. Dollar in the past 20 years....

by Chris Kimble | Apr 14, 2015 | Kimble Charting
CLICK ON CHART TO ENLARGE This chart looks at Crude Oil over the past couple of decades, on a monthly basis. Crude Oils large decline over the past 8 months took it down to its Fibonacce 23% retracement level and a support line at the same time. The large...

by Chris Kimble | Oct 23, 2014 | Kimble Charting
CLICK ON CHART TO ENLARGE The past 90 days have not been kind to Crude Oil or Energy Stocks. Energy ETF XLE is down 15% in the past 90 days, talking about a big punch in the face! This decline took XLE back to rising support off the 2010 lows and created a...
by Chris Kimble | Sep 26, 2014 | Kimble Charting
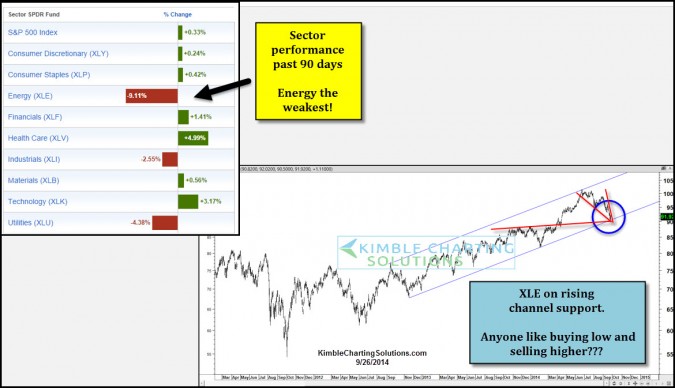
CLICK ON CHART TO ENLARGE Do you like to buy low and sell higher? XLE is the worst performing S&P 500 sector over the past 30 & 90 days. This decline has taken it down to support of this rising channel, that has been in place since late 2012. –...
by Chris Kimble | Feb 11, 2014 | Kimble Charting
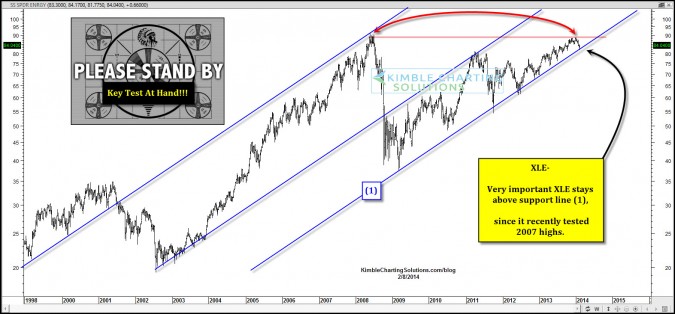
CLICK ON CHART TO ENLARGE The Dow and S&P 500 are near all-time highs, energy stocks are attempting to join them. Energy ETF (XLE) recently hit its 2007 highs and backed off a little. The decline now has XLE testing support of this 6-year rising...

by Chris Kimble | May 28, 2013 | Kimble Charting
CLICK ON CHART TO ENLARGE I shared with Premium members last week that a bullish ascending triangle was taking place in Energy ETF (XLE) and that a breakout should be owned. XLE has reflected relative weakness compared to the S&P 500 over the past 90 days,...
