
by Chris Kimble | Mar 4, 2015 | Kimble Charting
CLICK ON CHART TO ENLARGE The chart below looks back on the past 31 days and reflects that the S&P 500 did well (up over 5%). During this rally, investors confidence grew and fear levels fell hard (over 30%). The above chart takes a look at the VIX index, which...

by Chris Kimble | Feb 20, 2015 | Kimble Charting
CLICK ON CHART TO ENLARGE When excess fear seems to be in the market, opportunities can crop up. Of late the VIX index (fear trade) remained elevated for a good period of time. The “Anti” fear trade is owning XIV. Recently I shared with Premium Members...

by Chris Kimble | Feb 12, 2015 | Kimble Charting
CLICK ON CHART TO ENLARGE The Fear index (VIX) has remained at lofty levels for an unusual length of time, attempting to break above long-term resistance. The VIX almost appears to have made a “Triple Top” at this long-term resistance line at (1) above....
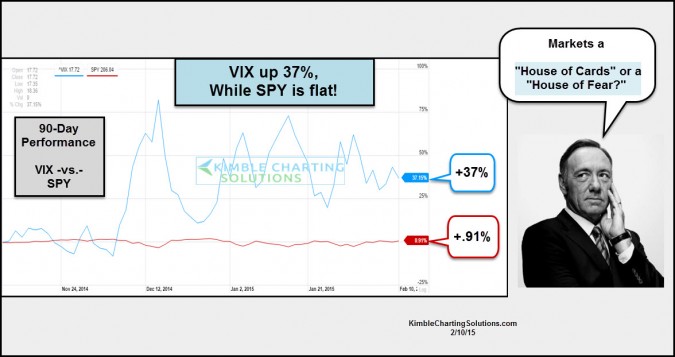
by Chris Kimble | Feb 10, 2015 | Kimble Charting
CLICK ON CHART TO ENLARGE Do some investors think the market is a “House of Cards?” Humbly I don’t know. It sure seems like something has them concerned, as fear levels remain lofty with the market making little progress up or down! Over the...

by Chris Kimble | Jan 8, 2015 | Kimble Charting
CLICK ON CHART TO ENLARGE 2015 has gotten off to some wild swings, to say the least. The past 2 days (4th and 5th day of a New Year) have been the strongest since 1950, pushing the S&P 500 up 2.97%. This comes on the heals of the S&P getting off...
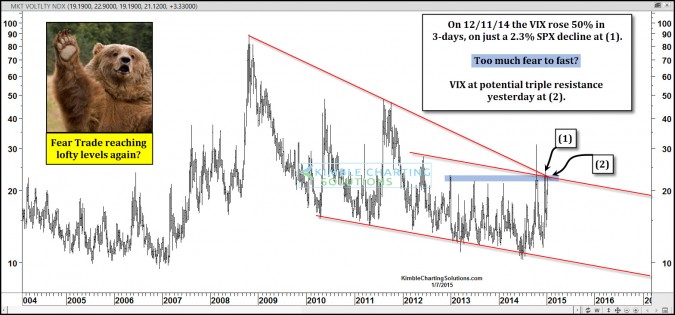
by Chris Kimble | Jan 7, 2015 | Kimble Charting
CLICK ON CHART TO ENLARGE Can the VIX (Fear Trade) rise 50% in 3-days with the S&P 500 falling less than 3%? Is that possible? If that would happen, does that sound like a short-term extreme/panic from the investing community to you? Well it did happen!...
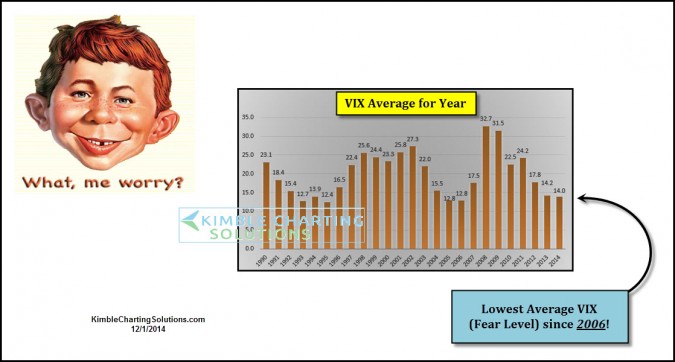
by Chris Kimble | Dec 2, 2014 | Kimble Charting
CLICK ON CHART TO ENLARGE When it comes to investors fearing the stock market, this year won’t set any records for “excess fear.” The above table highlights annual averages for the VIX (Fear Index) over the past 24 years. The VIX index...

by Chris Kimble | Nov 14, 2014 | Kimble Charting
CLICK ON CHART TO ENLARGE When the sky is falling crowd grew large one month ago tomorrow, Premium Members stepped in and bought the inverse fear ETF (XIV) and is was falling off the table and created a bullish wick, highlighted in the chart above. I shared...
