
by Chris Kimble | May 2, 2017 | Kimble Charting
Below looks at the FTSE 100 index from London, over the past 30-years. The long-term trend in this important index from Europe remains up, as it has created a series of highs lower and higher highs, since the 2009 lows. The FTSE has spent the majority of the past...

by Chris Kimble | Oct 27, 2016 | Kimble Charting
Four months ago the world seemed scared that the Brexit vote would be negative for Europe and potentially around the world. Four months later, almost the polar opposite deserves discussion. Below updates the FTSE -100 Index on a monthly basis over the past few...

by Chris Kimble | Jul 18, 2016 | Kimble Charting
Could be an important time for London right now! Below looks at the FTSE 100 (London) over the past 6-years. CLICK ON CHART TO ENLARGE As mentioned above, the FTSE 100 remains inside of a 6-year rising channel. Two support was tested this year at (1). While testing...

by Chris Kimble | Jul 11, 2016 | Kimble Charting
The day before the Brexit vote, you could cut the “Fear” with a knife, it was so thick. The media was full of articles reflecting tons of fear about the outcome. The Power of the Pattern shared that Brexit could be about as impactful as Y2K and that the...

by Chris Kimble | Jun 29, 2016 | Uncategorized
The media seems to be focused on the Brexit issue, with most of the coverage suggesting it was a negative event. Regardless of the media’s focus, prices are attempting to do something in Europe, that could be bullish and surprise a few investors. CLICK ON CHART...

by Chris Kimble | Jun 28, 2016 | Uncategorized
While the media is focused on the noise around Brexit, yesterday the Power of the Pattern shared that Germany (DAX) and London (FTSE) remained above 6-year rising support. See post HERE. Below takes a closer look at the FTSE index in London, the so called center of...

by Chris Kimble | Jun 23, 2016 | Uncategorized
The media has had a hay day for months, over the “Brexit” vote in Europe. They have done a great job of concerning people in Europe and around the world. Could Brexit and Y2K both end up scaring people/investors, yet it end up being not too big of an...
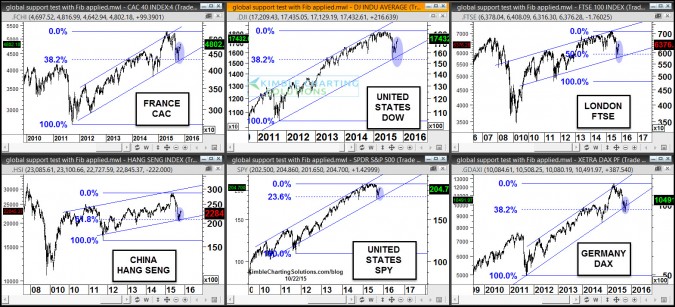
by Chris Kimble | Oct 22, 2015 | Kimble Charting
CLICK ON CHART TO ENLARGE Ryan Detrick, head of Statistical analysis for Kimble Charting Solutions and I were honored to be on a “Chart Art” panel this past week, at the Stocktoberfest meeting at Coronado Island. The main thrust of our talk was this;...
