by Chris Kimble | Mar 25, 2019 | Kimble Charting
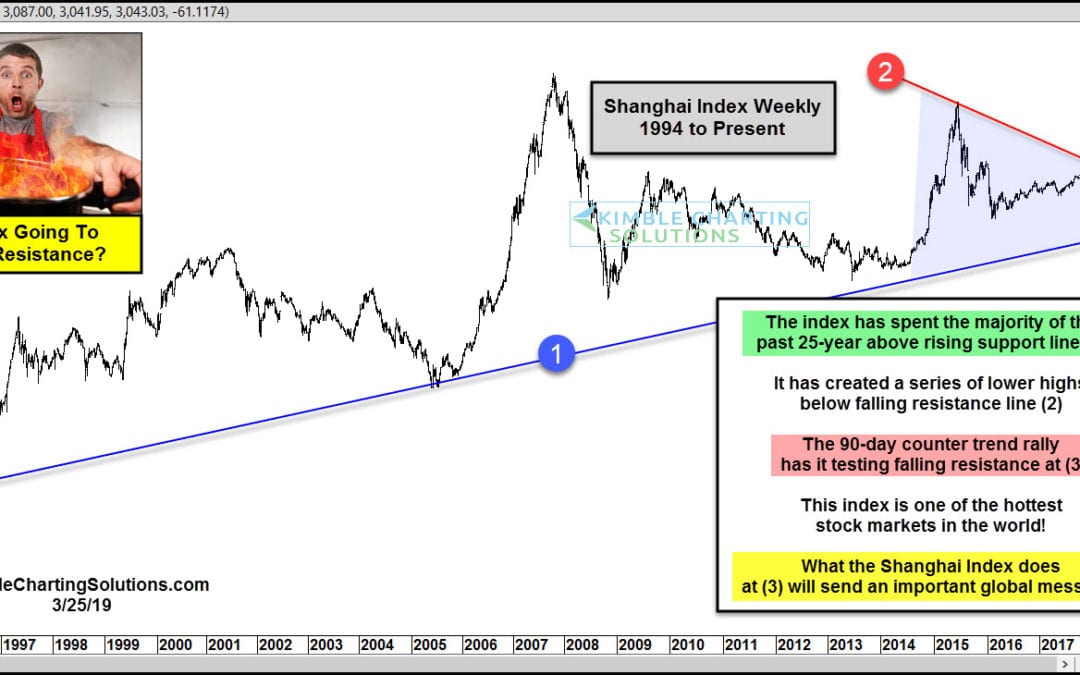
Is one of the hottest stock indices in the world about to peak? Possible. The S&P is off to a great start this year, up over 12%. Yet the Shanghai index is white hot, up around 22%, almost twice as much as the S&P 500! This chart looks at the Shanghai Index...
by Chris Kimble | Oct 30, 2018 | Kimble Charting
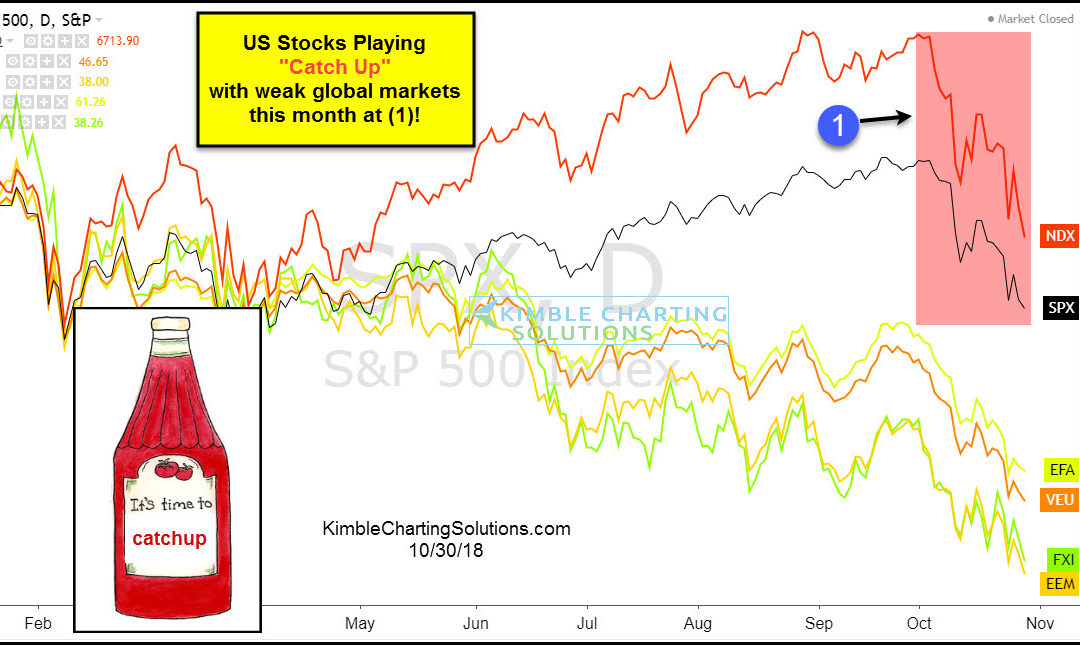
CLICK ON CHART TO ENLARGE Numerous global stocks indices peaked in January as they started creating a series of lower highs and lower lows. While a good deal of global stocks were heading south, major indices in the states continued higher. This divergence created...
by Chris Kimble | Sep 13, 2018 | Kimble Charting
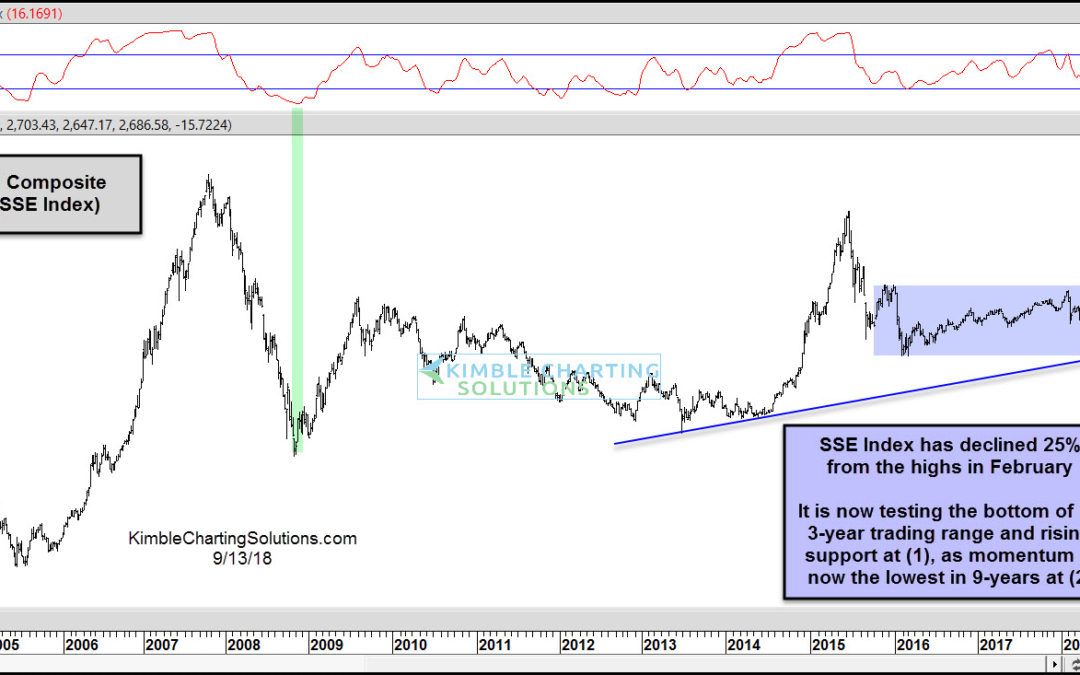
CLICK ON CHART TO ENLARGE While the S&P 500 and many indices in the states are trading near all-time highs, the same thing can’t be said for stocks in China! Since the highs in February, the Shanghai Index (SSE) has declined nearly 25%. Could this large...
by Chris Kimble | Aug 29, 2018 | Kimble Charting
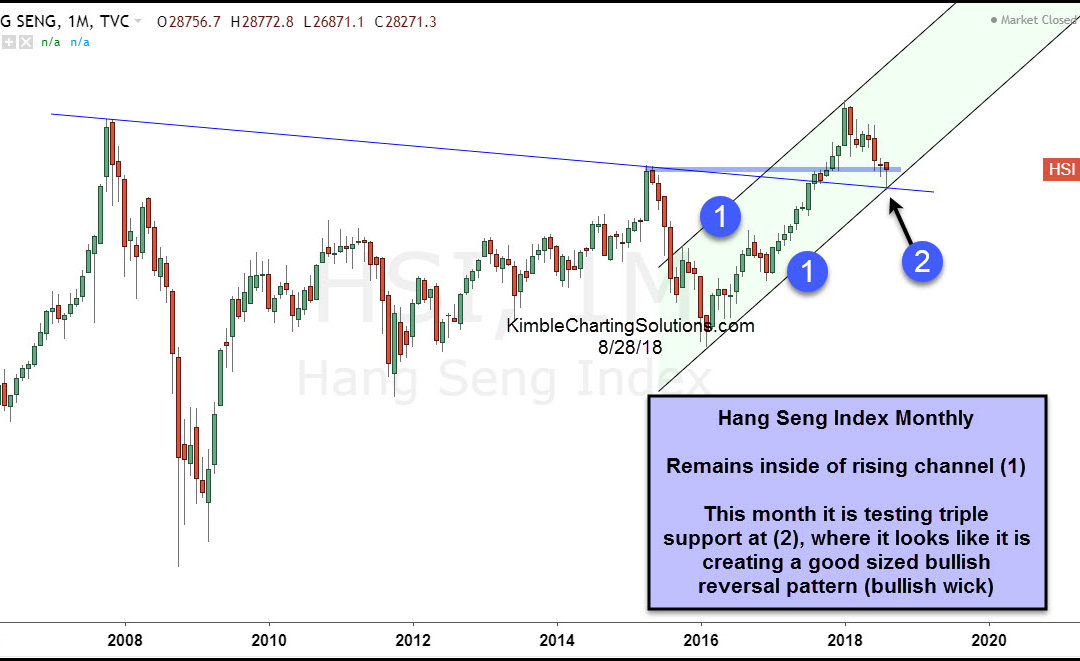
The hard-hit Chinese Hang Seng Index tested a big support level this month. Is this key Chinese stock market index ready to stage a rally here? Let’s take a look at today’s 2-pack of charts to see why the Hang Seng Index (and perhaps select emerging markets) could be...

by Chris Kimble | Feb 8, 2018 | Kimble Charting
Stocks in the states have done well the past few years and so have stocks in Emerging Markets countries and China Below looks at popular Emerging Markets ETF (EEM) and China ETF (FXI) over the past 10-years- CLICK ON CHART TO ENLARGE EEM & FXI have both done...

by Chris Kimble | Oct 14, 2017 | Kimble Charting
Emerging Markets ETF (EEM) did something this week, it has been unable to do numerous times over the past 5-years. Below looks at the price pattern of EEM over the past 10-years. CLICK ON CHART TO ENLARGE EEM has done well since the start of 2016, reflecting gains...

by Chris Kimble | Jul 19, 2017 | Kimble Charting
China ETF (FXI) in 2015 started falling hard. While it was doing so, it left a “large unfilled weekly gap” on the charts. Could that gap create an opportunity? Very Possible! Below looks at FXI on a weekly basis over the past 4-years- CLICK ON CHART TO...

by Chris Kimble | Apr 8, 2015 | Kimble Charting
CLICK ON CHART TO ENLARGE I wish I had a Dollar for every time I heard that China can’t do well if Copper isn’t moving higher. Over the past 6 months, China ETF FXI is up 28% while Copper ETF JJC is down over 10%. This is nearly a 40% performance...
