by Chris Kimble | May 24, 2018 | Kimble Charting
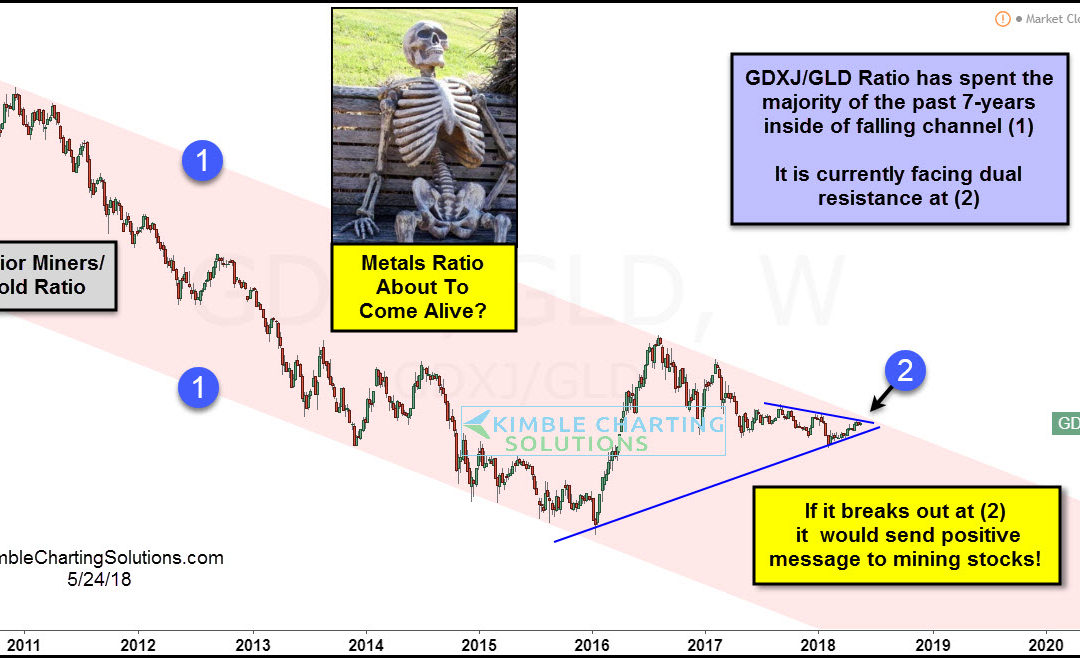
CLICK ON CHART TO ENLARGE This chart looks at the Junior Miners (GDXJ) to Gold ratio over the past 7-years. Metals bulls want to this ratio heading higher, to send a positive message to this sector. The ratio has spent the majority of the past 7-years inside of...
by Chris Kimble | May 22, 2018 | Kimble Charting
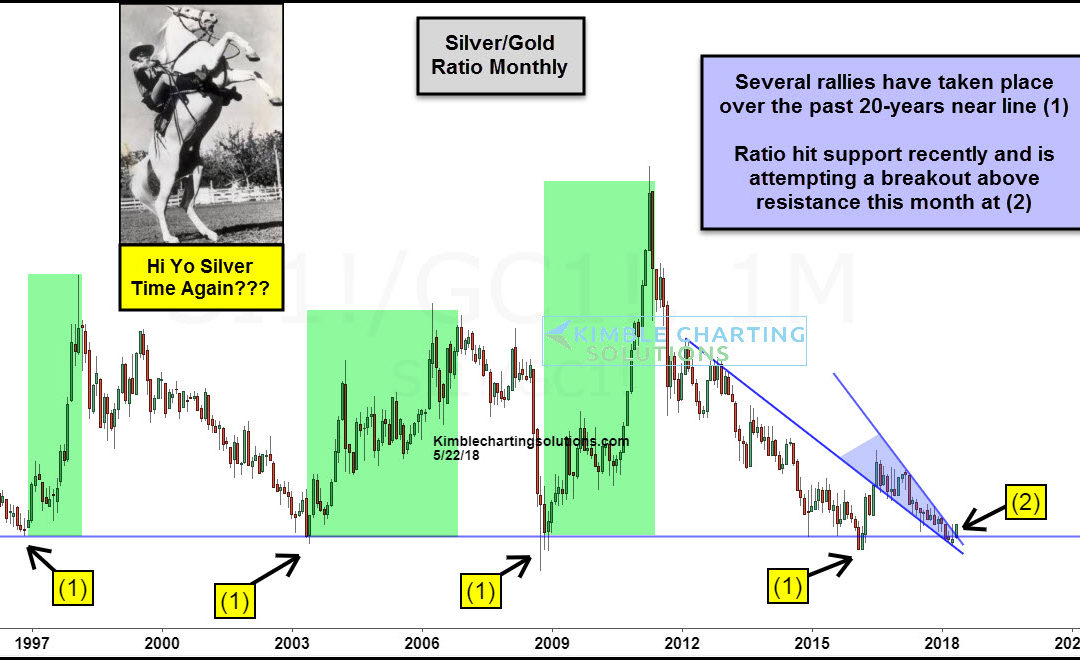
CLICK ON CHART TO ENLARGE This chart looks at the Silver/Gold ratio on a monthly basis over the past 20-years. When the ratio is heading higher, Silver is stronger than Gold. Since the 2011 highs, the majority of the time the ratio has been heading lower, reflecting...
by Chris Kimble | May 3, 2018 | Kimble Charting
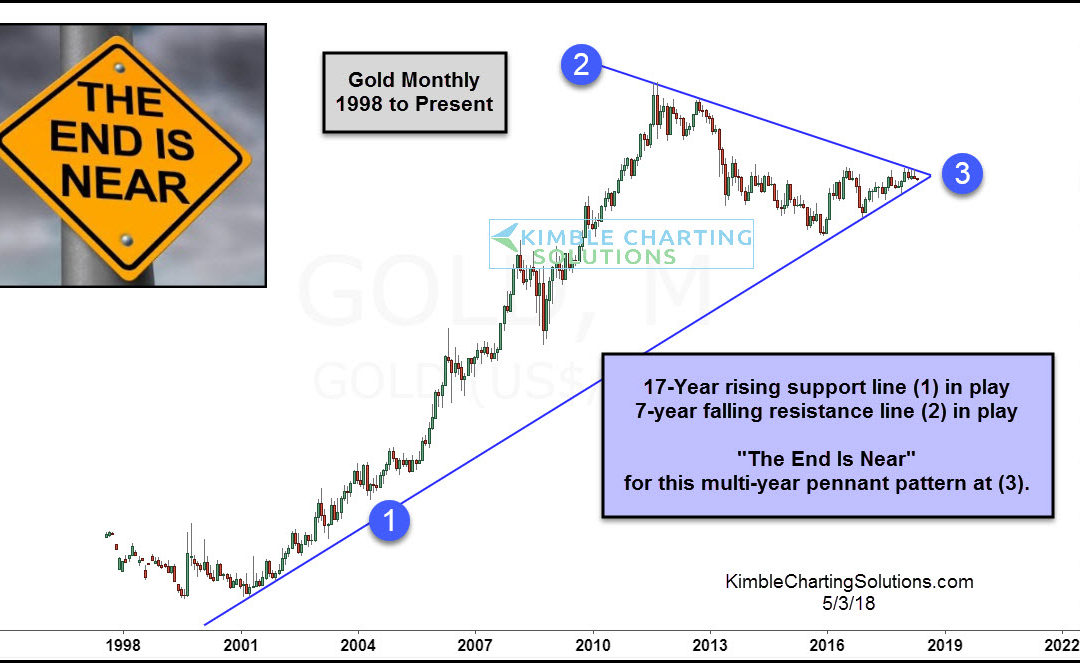
CLICK ON CHART TO ENLARGE The Long-Term trend for Gold is up, as it continues to remain above 17-year support line (1). The 7-year trend for Gold is down, as it continues to trade below falling resistance line (2). These two long-term support/resistance lines look to...

by Chris Kimble | Feb 16, 2018 | Kimble Charting
Gold investors have enjoyed a strong start to 2018. After a brief pullback into early February, the shiny metal has charged higher once more. The question now: Is a major breakout on the way for gold and precious metals bulls? Looking at the chart below, you can see...

by Chris Kimble | Jan 31, 2018 | Kimble Charting
The 6-pack below updates chart patterns from the Gold and Steel sector that we share often on this blog. It is shared weekly with our Metals and Premium Members. The 6-pack below looks at Gold, Gold Miners (GDX & GDXJ), GDXJ/GDX ratio, Gold/US$ ratio and Steel ETF...
by Chris Kimble | Jan 24, 2018 | Kimble Charting
Silver and Silver ETF (SLV) has NOT been a good asset to buy & hold since the 2011 highs, as they have declined around 66% in the past 7-years. Could the long-term trend downtrend in Silver be about to end? Below looks at Silver Futures over the past 8-years-...
by Chris Kimble | Jan 12, 2018 | Kimble Charting
Below looks at the ratio of Silver to Gold over the past 30-years. Metals bulls historically receive a bullish message when this ratio is moving higher. Back in 2011, the ratio hit highs that took place in the early 1980’s and its been downhill for Gold and...

by Chris Kimble | Jan 4, 2018 | Kimble Charting
The U.S. Dollar plays a big role in commodities prices. It’s always a “must-watch” for commodity traders. Typically, a falling Dollar bodes well for commodities (priced in dollars). And we’ve seen this dynamic play out with Gold and precious metals of late. One...
