
by Chris Kimble | Aug 29, 2017 | Kimble Charting
Could weakness in Europe send a concerning message to stock bulls in the states? Yes they could! Before getting started let me make this clear, stock markets in Germany, France and London remain in long-term up trends. Below looks price patterns that Germany and...

by Chris Kimble | Aug 9, 2017 | Kimble Charting
Stock markets around the world remain highly correlated. With this in mind, the German stock market finds itself potentially kissing dual resistance, that could impact stocks in the states. CLICK ON CHART TO ENLARGE As mentioned above, the DAX remains inside of rising...

by Chris Kimble | Apr 18, 2017 | Kimble Charting
Many times over the years, what the stock markets do in Germany and Europe, impacts stocks in the states. Several times Germany has been a leading indicator in bull and bear moves, ahead of what take place in the S&P 500. Below looks that the DAX index over the...

by Chris Kimble | Mar 31, 2017 | Kimble Charting
Below looks at the DAX index from Germany over the past decade. The DAX index looks to be creating a bullish continuation pattern, that the Power of the Pattern feels, is important to investors in Europe and the States. CLICK ON CHART TO ENLARGE The lower left of the...

by Chris Kimble | Sep 26, 2016 | Kimble Charting
The German Stock Market has been a quality leader in both directions the past few years. Below looks at why one might want to keep a “close eye” on this key global stock index, to see if it can hop over a important breakout level. CLICK ON CHART TO ENLARGE...

by Chris Kimble | Aug 4, 2016 | Kimble Charting
The German DAX index has been a good leading indicator for stocks in the states. At this time the DAX is boxed in between 6-year rising support and 1-year falling resistance, see chart below. CLICK ON CHART TO ENLARGE In the states, the Dow and S&P 500 are near...
by Chris Kimble | Jun 20, 2016 | Uncategorized
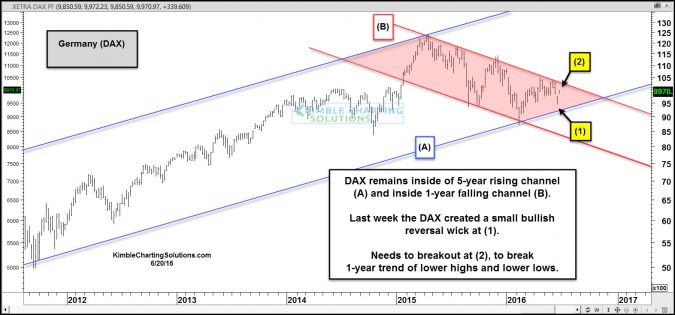
CLICK ON CHART TO ENLARGE DAX Index (Germany) continues its global leadership role. DAX remains inside of its 5-year rising channel (A). Top of the channel was hit over a year ago. After hitting the top of the channel, the DAX has continued to make a series of lower...

by Chris Kimble | Dec 4, 2015 | Kimble Charting
CLICK ON CHART TO ENLARGE The Power of the Pattern has been sharing with members for months, that what the DAX Index in Germany and Bio-Tech does, has a large impact, on the broad markets in the states. The chart above looks at the DAX index over the past few years....
