by Chris Kimble | Oct 18, 2023 | Kimble Charting
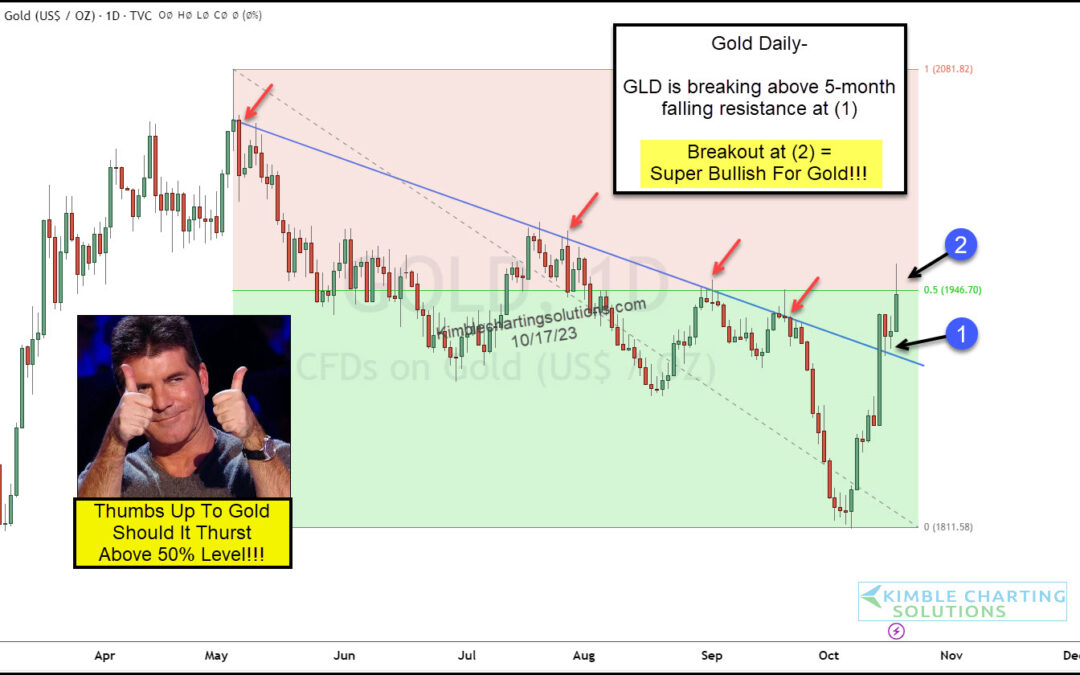
Gold prices have bounced around during a volatile multi-month pullback. Each rally has been met with more selling. Could that be changing soon? Today’s “daily” chart of the Gold Futures shows price breaking above its 5-month down-trend line at (1). This is good news...
by Chris Kimble | Jun 9, 2023 | Kimble Charting
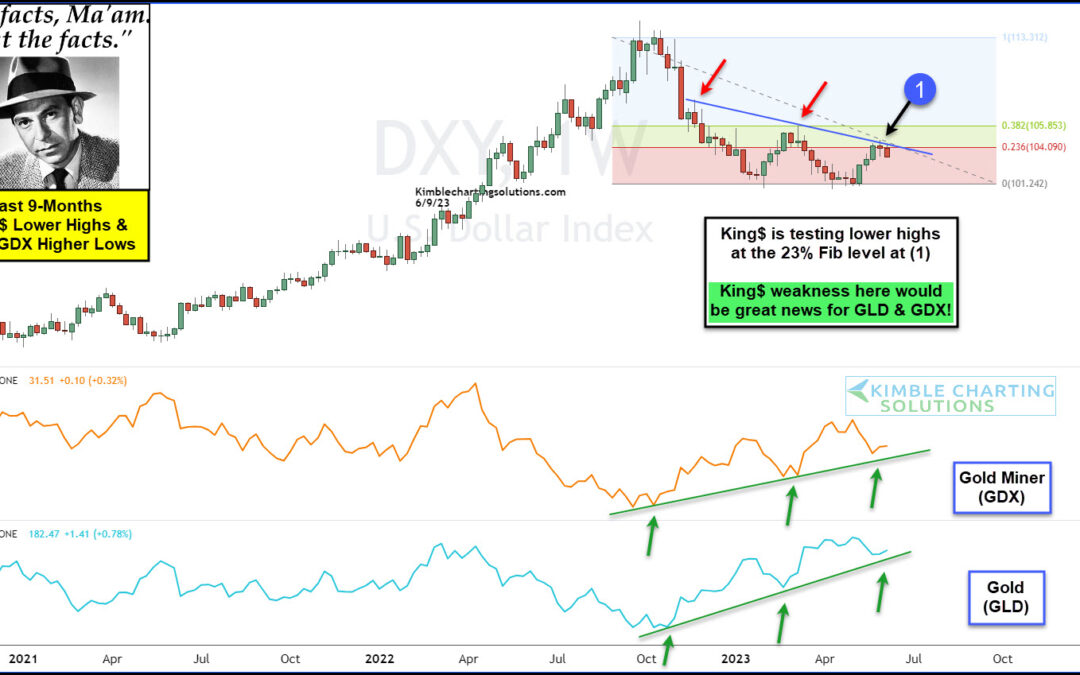
When the U.S. Dollar is strong, it is a headwind for precious metals. And when the U.S. Dollar is weak, it is a tailwind for precious metals. Today we check in on this relationship by looking at a “weekly” chart of the U.S. Dollar versus the Gold Miners ETF (GDX) and...
by Chris Kimble | May 24, 2023 | Kimble Charting
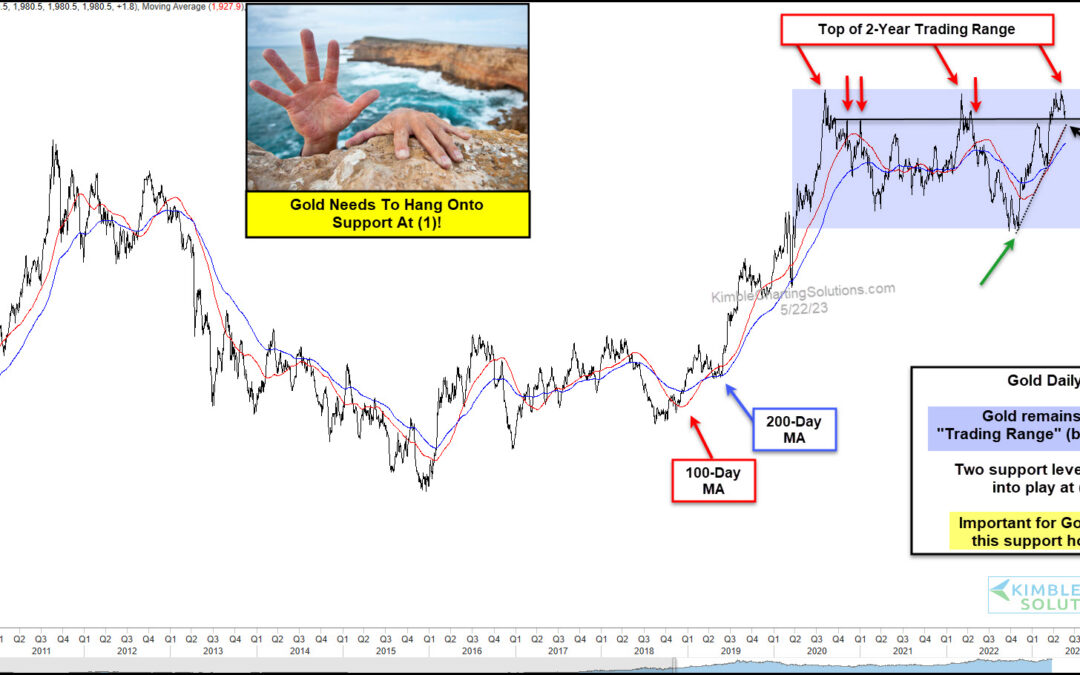
There’s so much uncertainty today that I think the markets are uncertain about being uncertain. I know Gold is sure trading like it. With so much uncertainty in the world today, it’s not surprising that Gold prices remain elevated. But each time it looks like a...
by Chris Kimble | May 15, 2023 | Kimble Charting
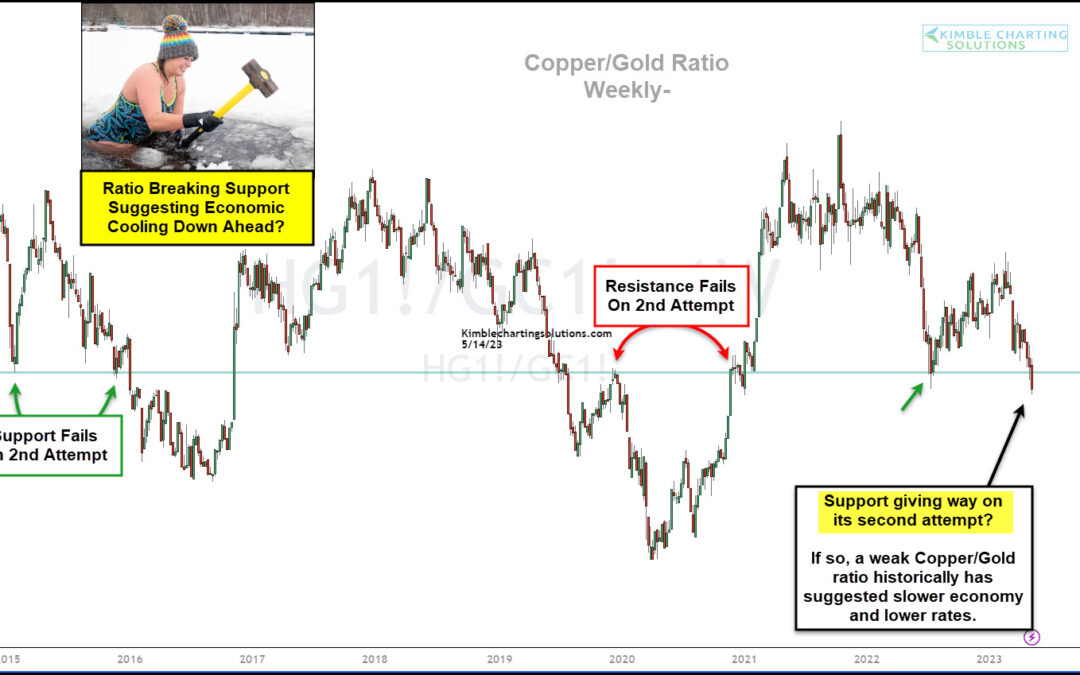
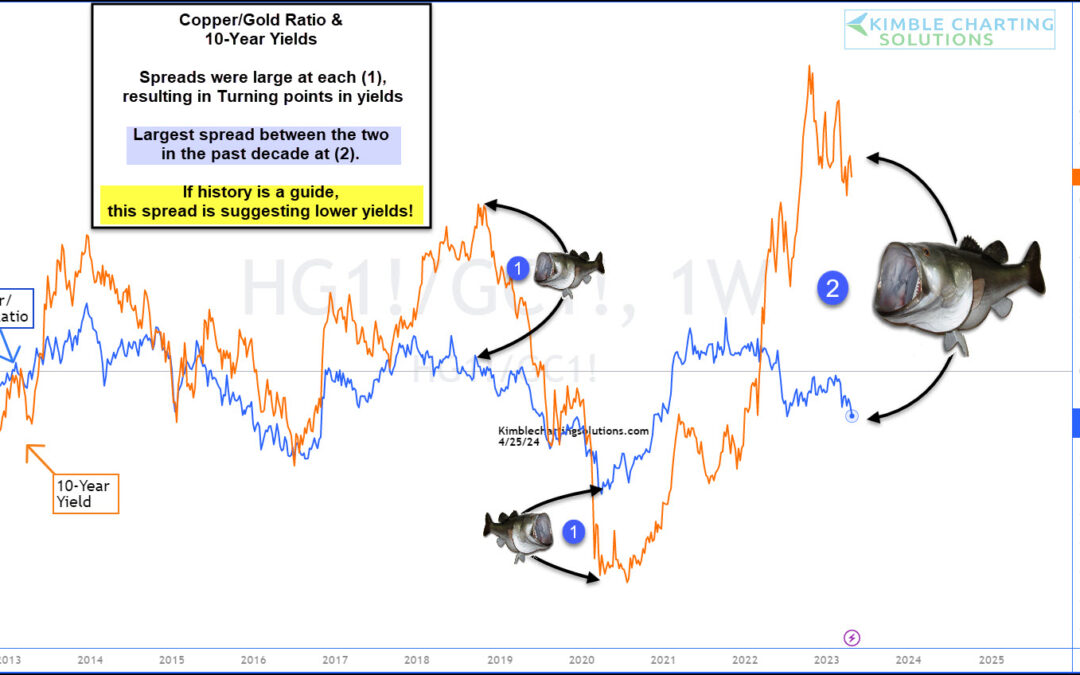
The world is full of economic concerns. Inflation, economic slowdown, global trade, and international war. So what’s next? Today’s chart might just might share a glimpse into the future. Below is a “weekly” chart of the Copper to Gold price ratio. Typically, when this...
by Chris Kimble | May 11, 2023 | Kimble Charting
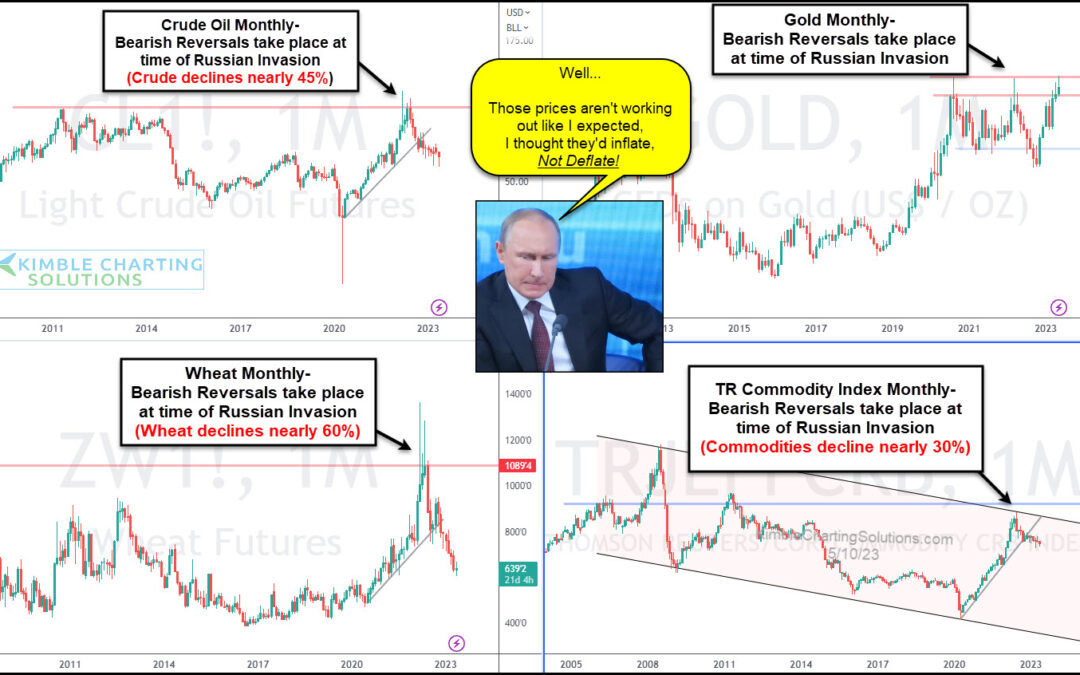
Market prices absorb all the information that’s out there. Perhaps that’s why several commodity prices surged in the months leading up to the Russian invasion of Ukraine. And since then, they have come back down to earth. I don’t think this is exactly how Putin...

by Chris Kimble | May 10, 2023 | Kimble Charting
The precious metals sector has remained elevated, yet volatile, over the past two years. Call it consolidation, but in my humble opinion, something has got to give. Inflation, war, politics… gold bulls have the catalysts and tailwinds to see higher prices. Today, we...
by Chris Kimble | Apr 26, 2023 | Kimble Charting
The past two years have seen headlines dogged by inflation and the Federal Reserve’s fight to end inflation. That fight has seen the Federal Reserve raise interest rates over and over again… and 10-year treasury bond yields have followed suit and risen sharply. One...
by Chris Kimble | Apr 13, 2023 | Kimble Charting
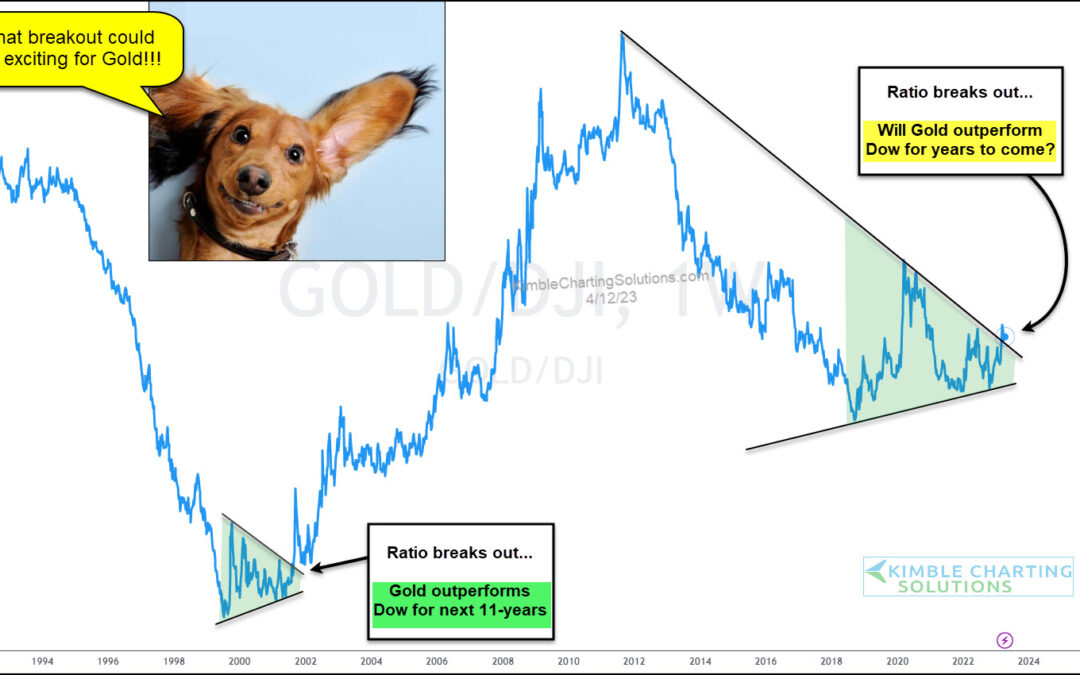
It’s been a decade since Gold outperformed the stock market on a steady basis. 2018-2019 was strong, but precious metals couldn’t keep the momentum going. Today’s chart looks at Gold’s relative performance based on its ratio to the Dow Jones Industrial Average. As you...
