by Chris Kimble | Feb 8, 2022 | Kimble Charting
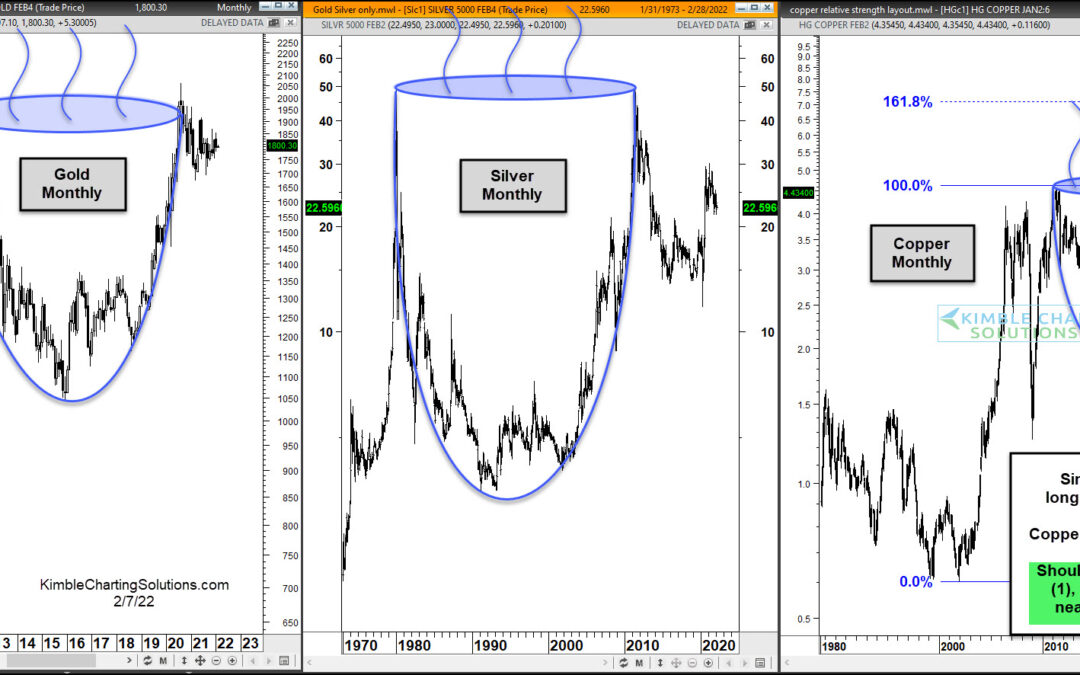
Each investor has to be aware of what their time-frame is. Are we looking at the coming days, weeks, months, or years. Some are traders and some are more active than others. Timeframes are particularly important right now for precious metals. Especially over the...
by Chris Kimble | Feb 3, 2022 | Kimble Charting
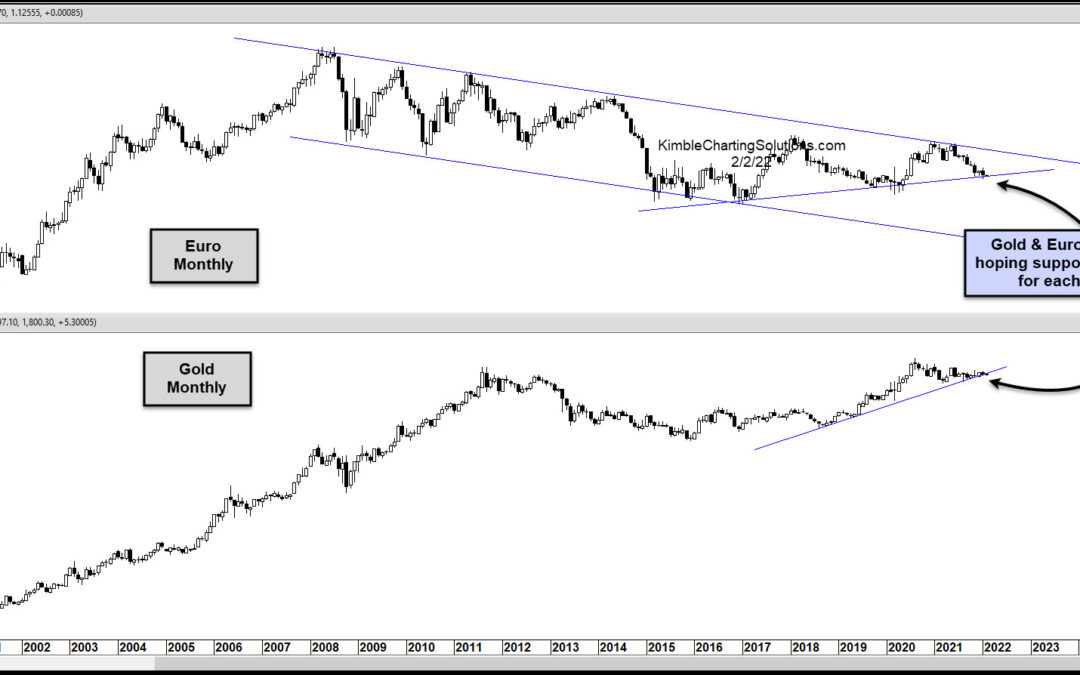
The price of Gold has been moving sideways-to-lower for months now. But this consolidation is nearing a potential inflection point. Today’s chart 2-pack highlights the long-term relationship between the Euro currency and the price of Gold. And, as you can see, moves...
by Chris Kimble | Jan 27, 2022 | Kimble Charting
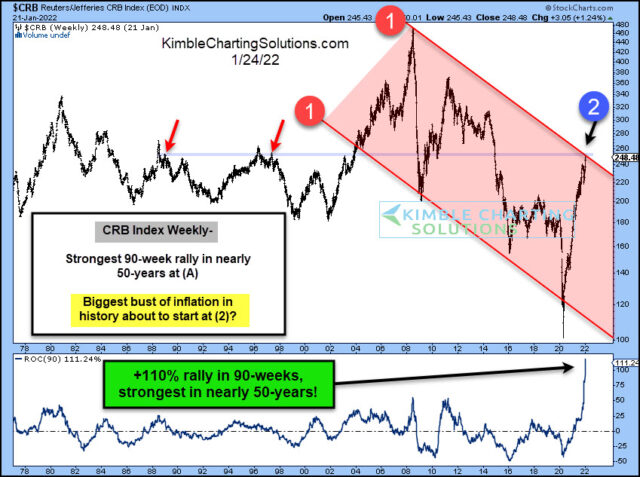
Commodities were already in a slump when coronavirus hit in 2020. That crash sent commodities to the lowest levels in decades. A quick economic rebound led to a return of demand which in turn led to shortages in 2021 and into 2022. So now what? Well, if you look at...

by Chris Kimble | Oct 1, 2021 | Kimble Charting
The precious metals arena has reached important junctures for both Silver and gold. Yesterday, we highlighted an important test of support for Silver. Today, we look at a “monthly” chart of the Gold / US Dollar Ratio and highlight a similar test of support. As you can...
by Chris Kimble | Sep 30, 2021 | Kimble Charting
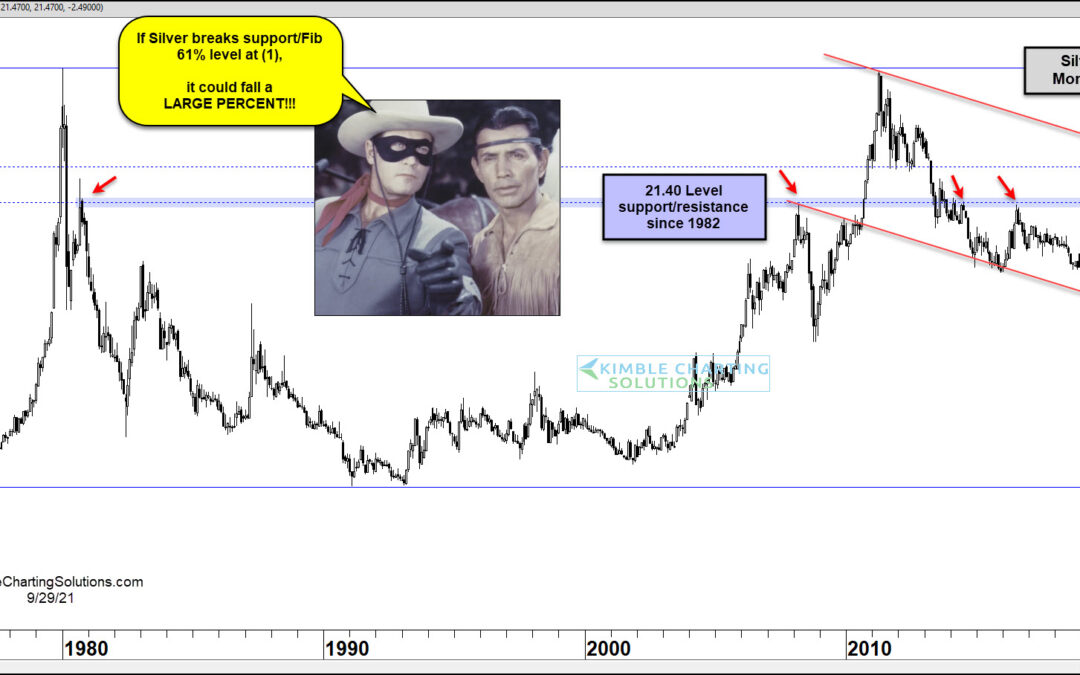
The past four months have been rough for Silver futures. And it may get worse before it gets better if the price of silver doesn’t reverse higher soon! Today we look at a long-term “monthly” chart of Silver futures and point out an important line in the sand for...
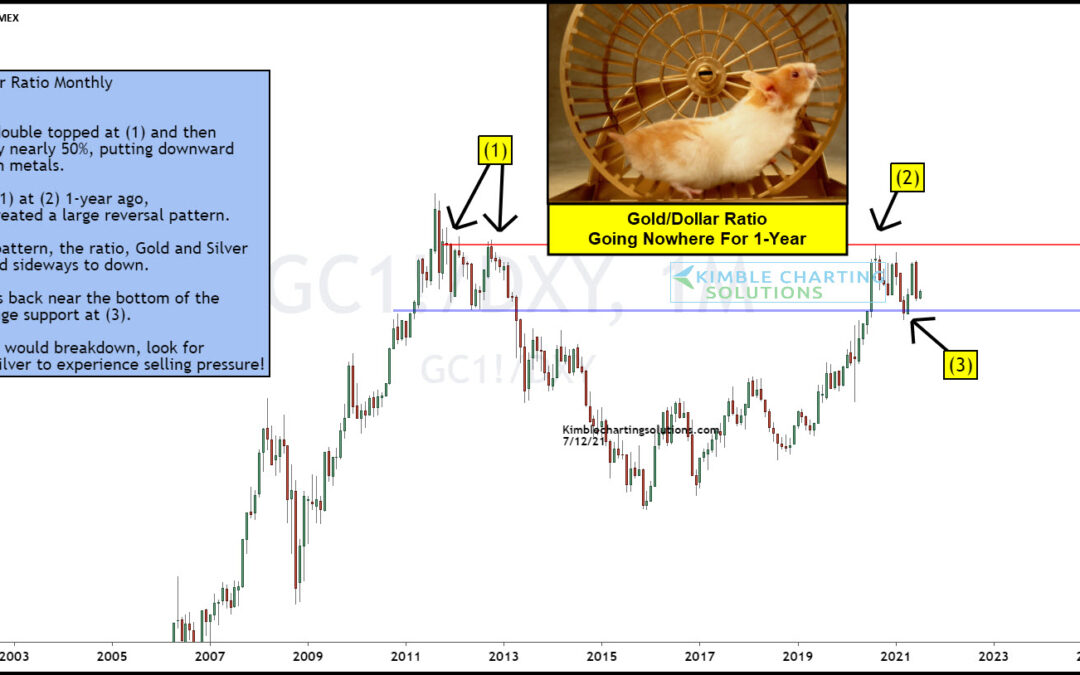
by Chris Kimble | Jul 13, 2021 | Kimble Charting
It’s been a decade of ebb and flow for Gold. Bulls have seen the best of times (new all-time highs), the worst of times (nearly 50 percent decline), and nearly the best of times again (test of all-time highs)… Today’s Gold to US Dollar Ratio “monthly” chart depicts...
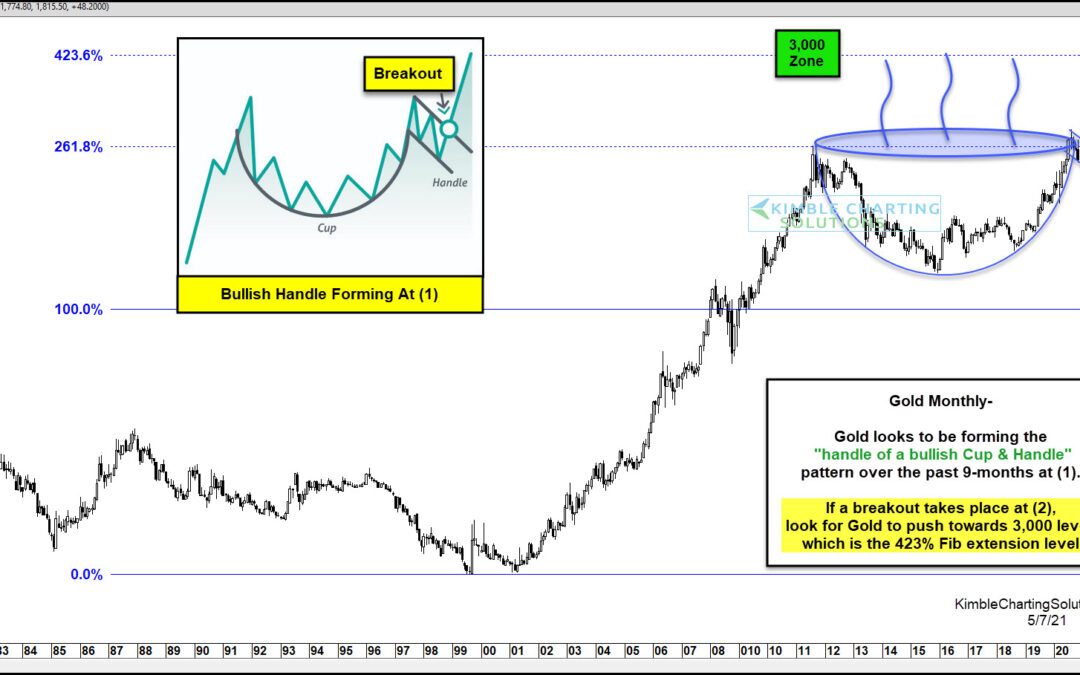
by Chris Kimble | May 8, 2021 | Kimble Charting
Okay, so we are having a little bit of fun here… but this really is a massively bullish pattern for Gold. And we have been tracking this Gold cup with handle pattern since early 2020. Read our last update here. As you can see in the “monthly” Gold chart above, the...
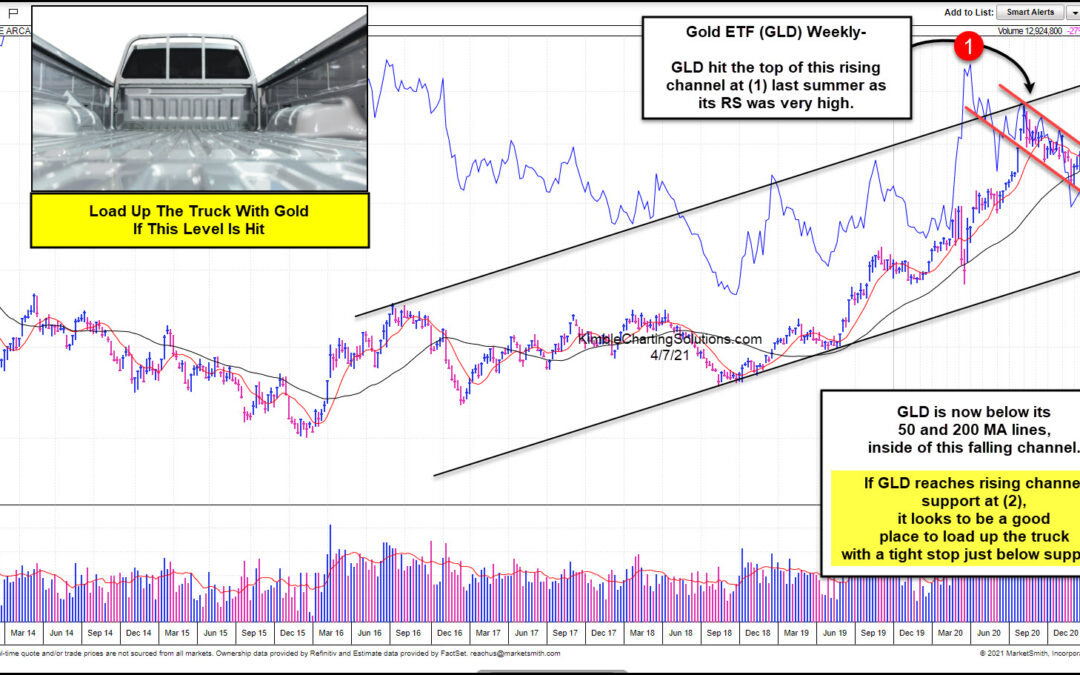
by Chris Kimble | Apr 7, 2021 | Kimble Charting
Gold has created lower highs since peaking last summer. Is Gold near a low? Where would a nice entry point come into play? This chart looks at Gold ETF (GLD) on a weekly basis over the past few years. GLD hit the top of this rising channel at (1) last summer, as it...
