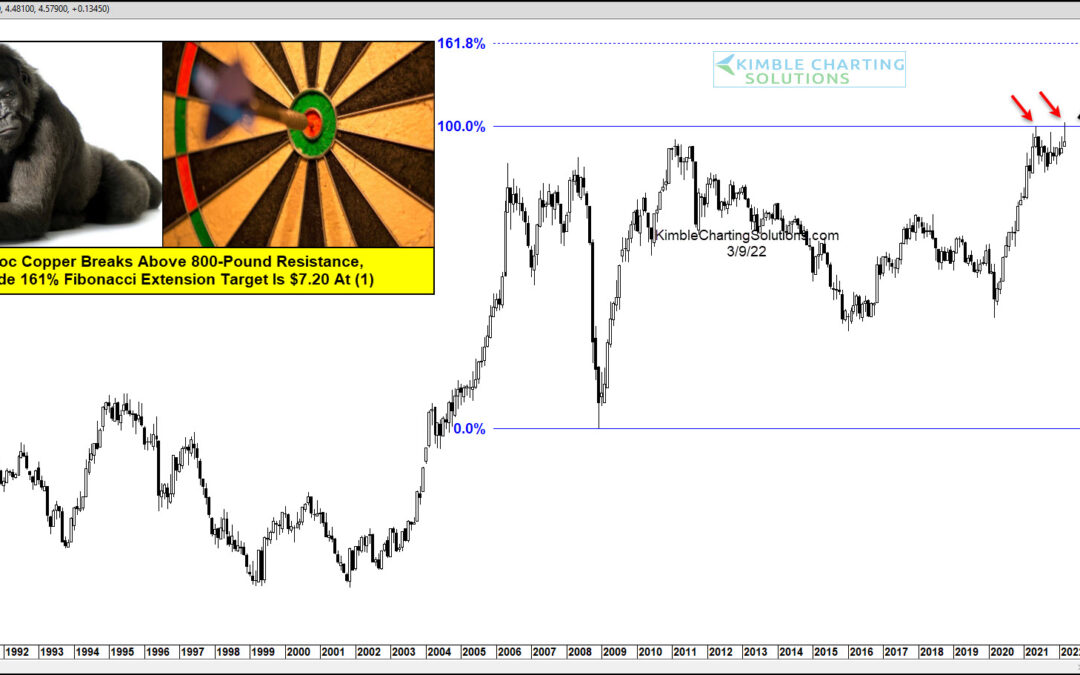
by Chris Kimble | Mar 10, 2022 | Kimble Charting
Copper prices have been running hot ever since the onset of COVID. Sound familiar? Yep, because it’s happened across several commodities. Things are rough right now on the inflation front… but could it get worse before it gets better? Today we look at the long-term...
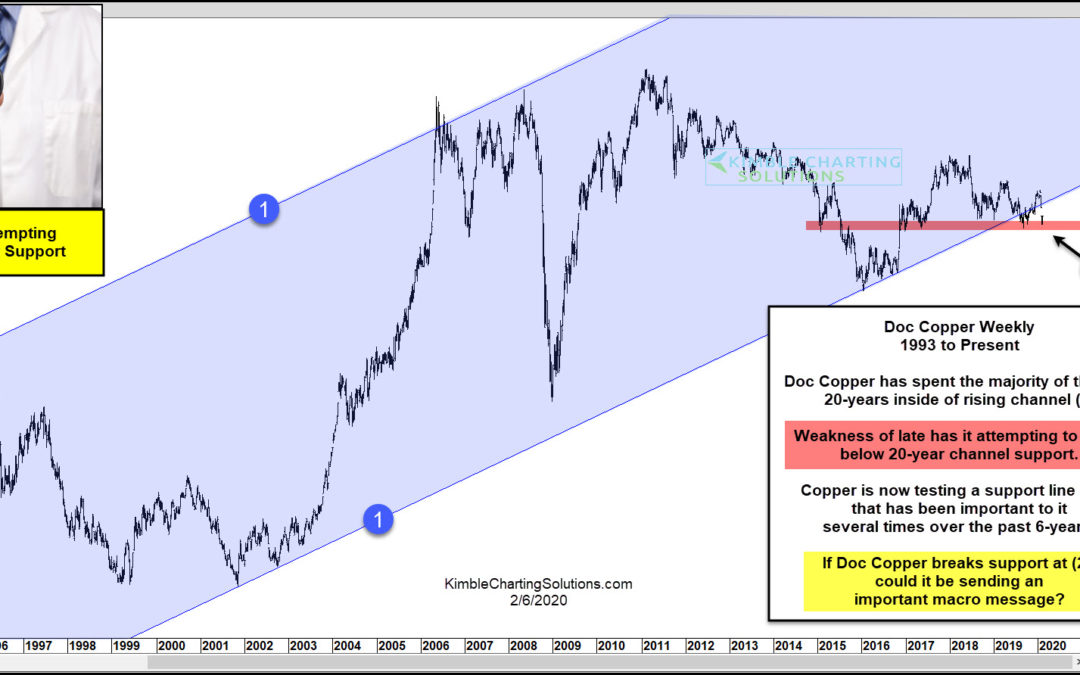
by Chris Kimble | Feb 6, 2020 | Kimble Charting
If the saying “So Goes Doc Copper, So Goes The Global Economy” is true, what Ole Doc Copper does from current levels will send an important message to global markets! Doc Copper has spent the majority of the past two decades inside of bullish rising...
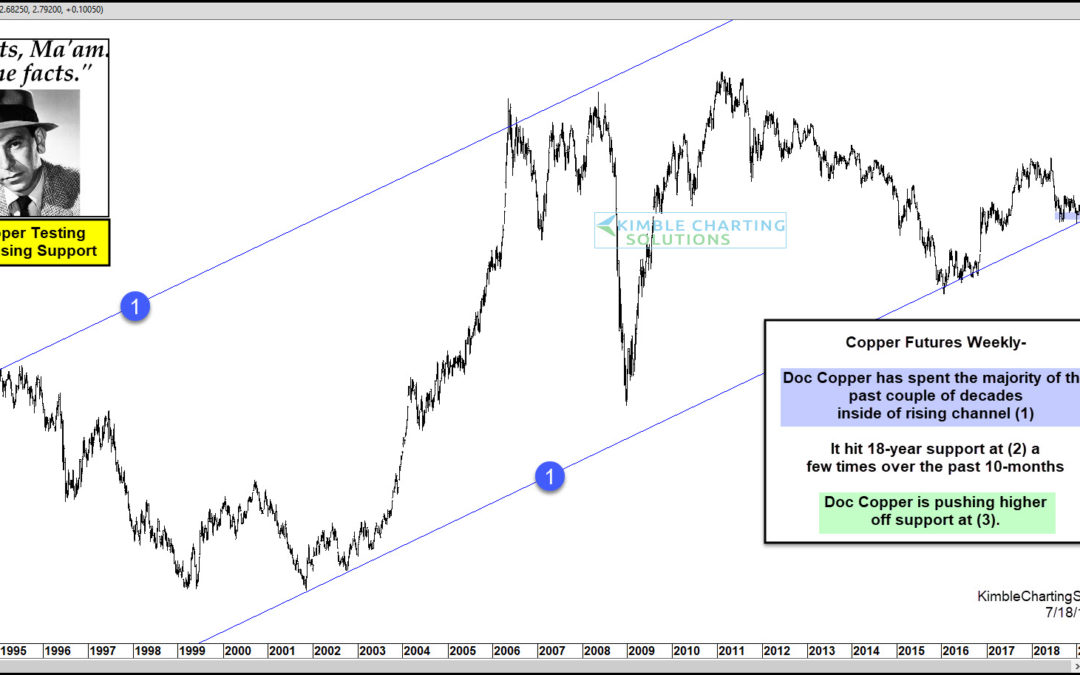
by Chris Kimble | Jul 19, 2019 | Kimble Charting
Gold & Silver have been hot of late! Is Doc Copper about to do the same? Possible says Joe Friday. This chart looks at Copper Futures over the past 27-years. Copper has spent the majority of that time inside of rising channel (1). The decline over the past year...
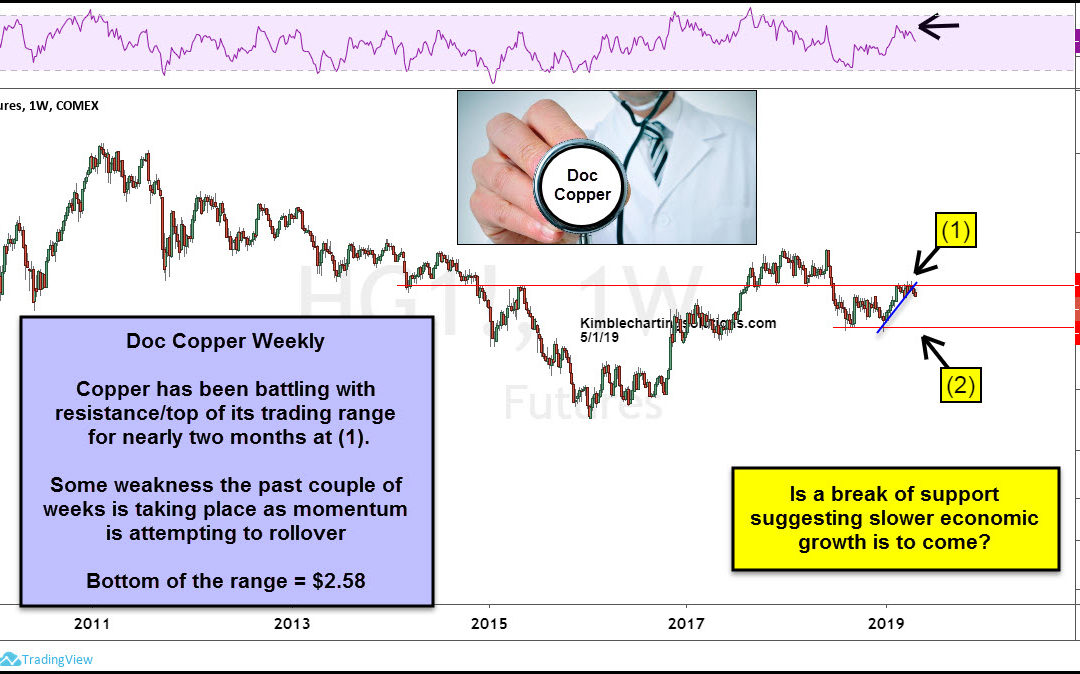
by Chris Kimble | May 1, 2019 | Kimble Charting
Is Doc Copper of late suggesting the economy is about to slow down? Possible! Copper futures have remained in a trading range since last summer, with resistance around $2.95 and support near $2.60. Over the past couple of months, Doc Copper has traded sideways near...
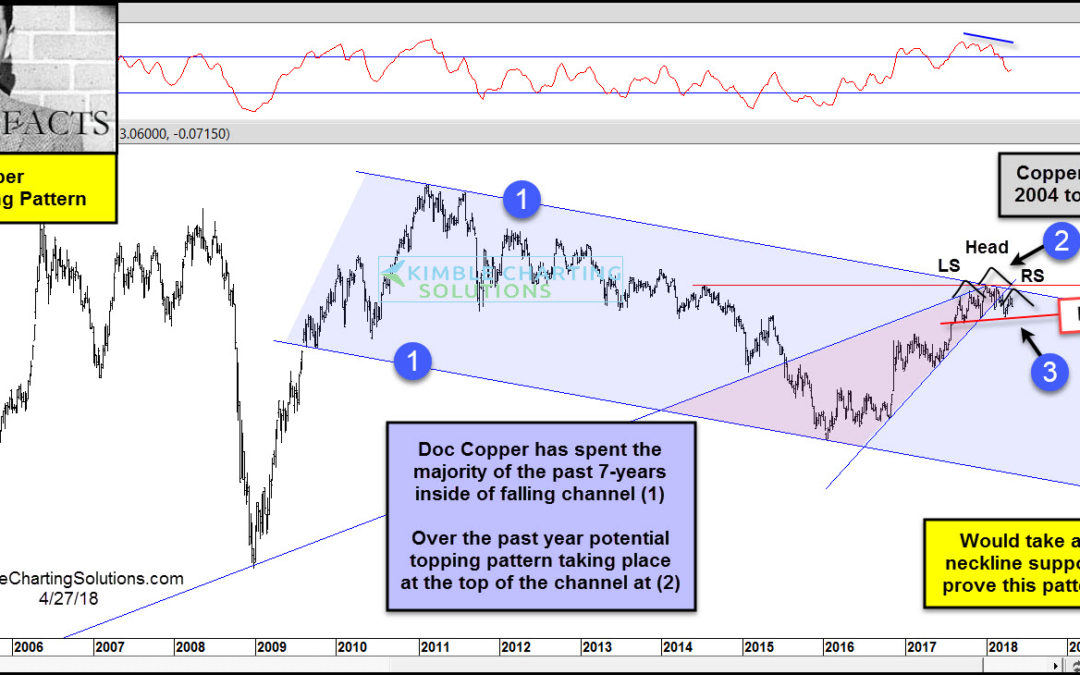
by Chris Kimble | Apr 27, 2018 | Kimble Charting
CLICK ON CHART TO ENLARGE The long-term trend of Doc Copper remains down, as it has created a series of lower highs and lower lows inside of falling channel (1) over the past 7-years. It hit the bottom of the channel in late 2015, where it found support and a rally...
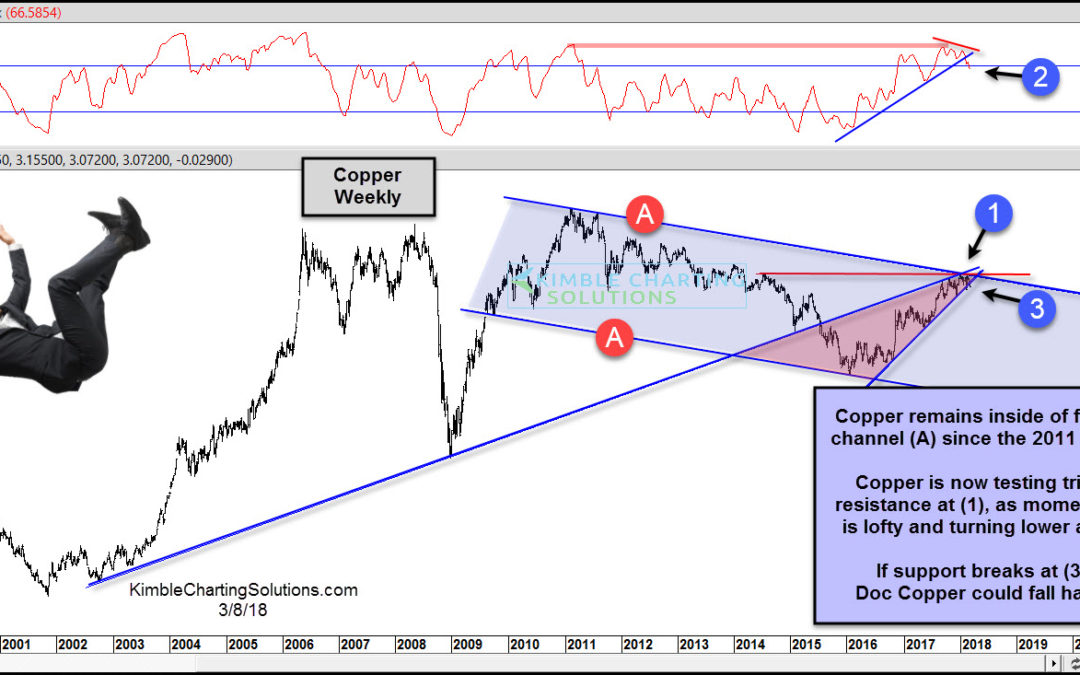
by Chris Kimble | Mar 8, 2018 | Kimble Charting
CLICK ON CHART TO ENLARGE Doc Copper peaked in 2011 and has remained inside of falling channel (A) ever since. It hit the bottom of the channel in 2016 and a 2-year rally has been in play. The rally now has Doc Copper testing the top of falling channel (A) and the...
by Chris Kimble | Jan 23, 2018 | Kimble Charting
Ole Doc Copper has had a rough go of it when looking back over the past 7-years, as it peaked in 2011. Ole Doc Copper has experienced nice gains over the past two years, as a strong counter-trend rally has taken place. Below looks at Copper Futures over the past...
by Chris Kimble | Dec 5, 2017 | Kimble Charting
Ole Doc Copper has performed very well over the past 2-years, as it has rallied 50%. Maybe the rally has been sent a positive message about the worlds macro picture? Could have and maybe stocks liked it. Below look at the price action of Doc Copper over the past...
