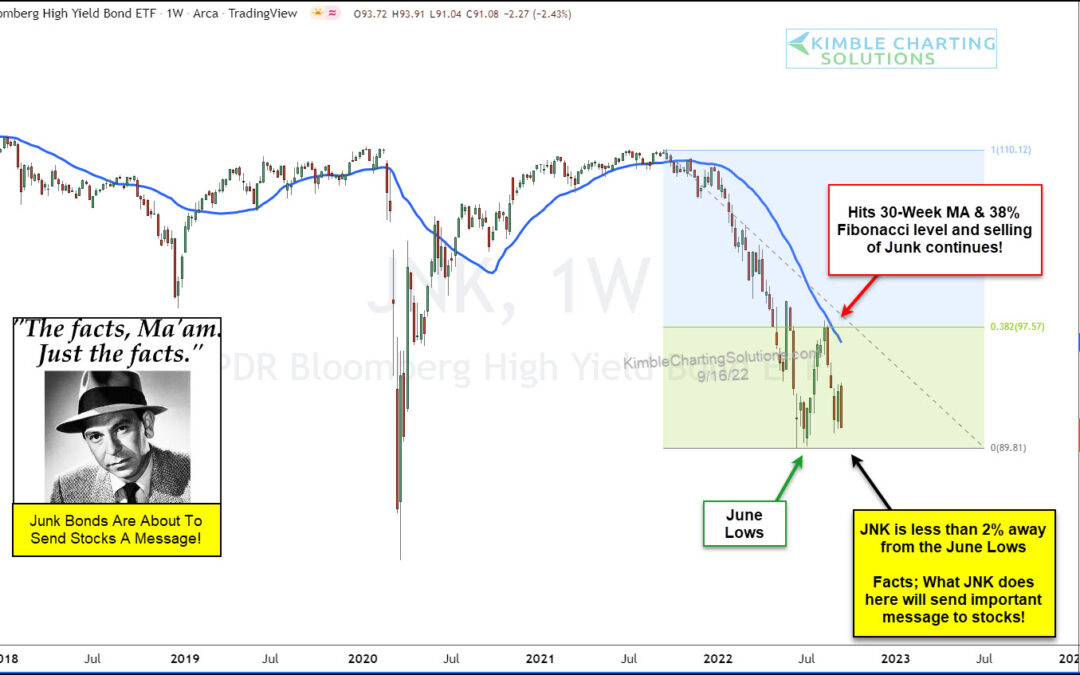
by Chris Kimble | Sep 16, 2022 | Kimble Charting
Junk bonds started sending a negative message to stocks last year, as junk bond ETF JNK broke below it’s 30-week moving average last September. Since falling below this important MA line, JNK has continued to decline, sending a RISK-OFF message to stocks. A...
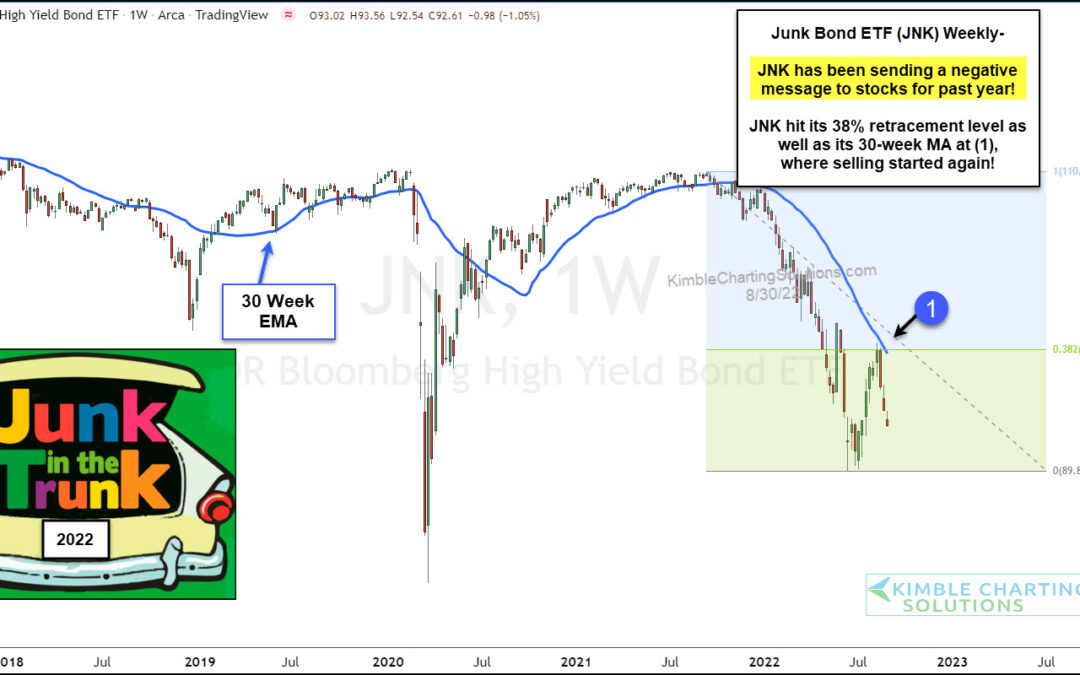
by Chris Kimble | Aug 31, 2022 | Kimble Charting
Stocks have been tumbling lately and several indexes are trading in oversold territory on a short-term basis. BUT, the bigger picture continues to be troubling. And one trading ETF / indicator that highlights this is the popular Junk Bond ETF (JNK). Above is the...
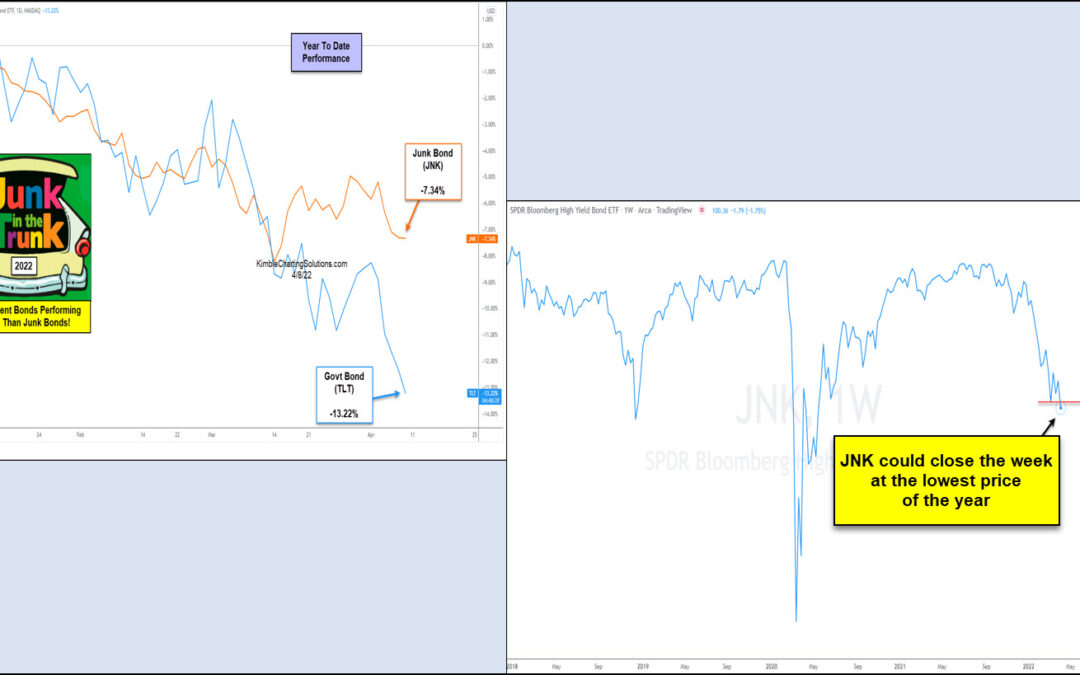
by Chris Kimble | Apr 11, 2022 | Kimble Charting
It’s been a crazy last couple of years. And that is probably an understatement. And 2022 is off to a similar start with supply disruptions, surging inflation, and war overseas. Needless to say, stocks are trading lower this year. And, no surprise, junk bonds are...
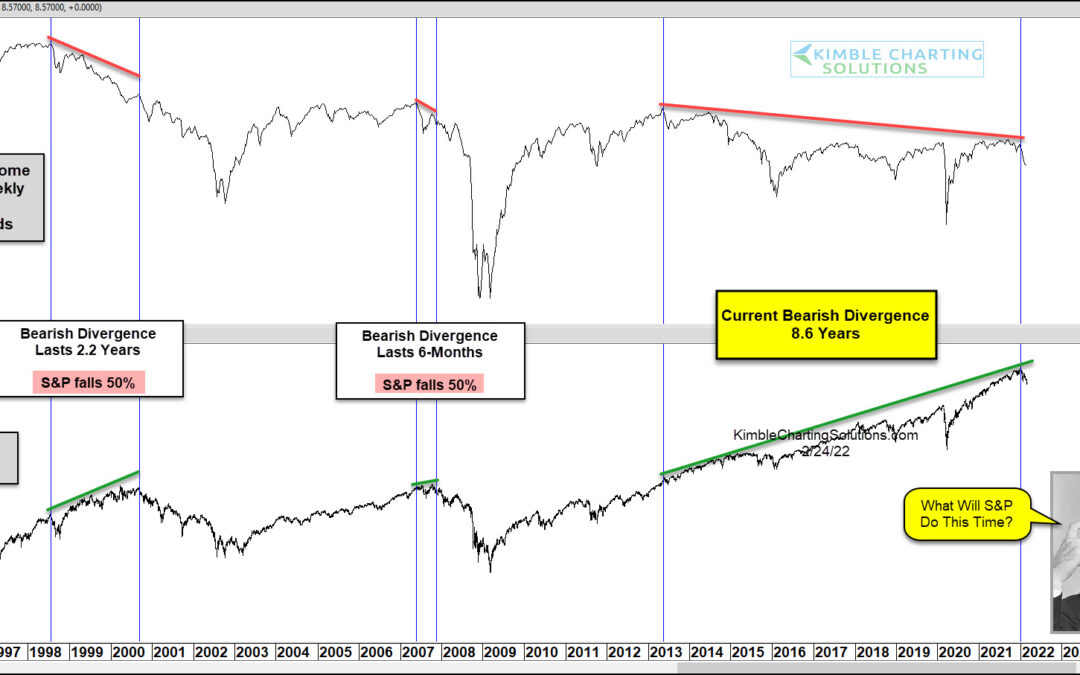
by Chris Kimble | Feb 26, 2022 | Kimble Charting
Before major market pullbacks, it is common to see internal market disconnections or divergences. And they often go on for much longer than investors think they will. Today we look at high yield junk bonds and when this asset diverges from the broader equities market....
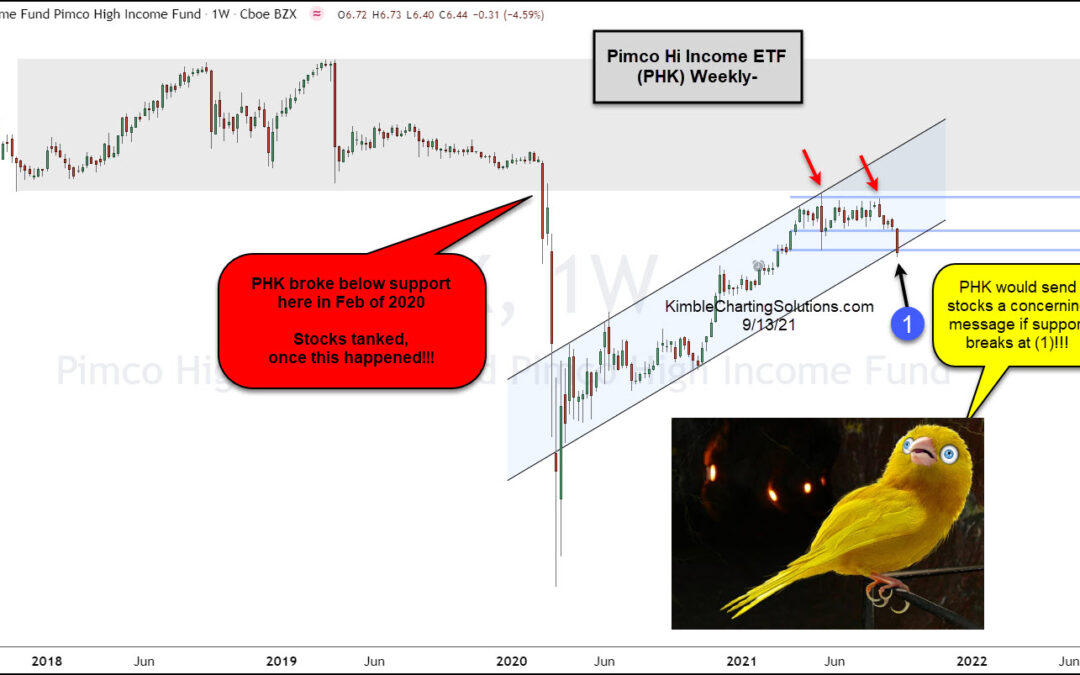
by Chris Kimble | Sep 13, 2021 | Kimble Charting
Watching high income (or high yield) bond funds has always been a good indicator of risk for the overall market, especially for stocks. Today’s chart takes a look at the Pimco High Income Fund ETF (PHK) and why investors need to be watching this ETF (as well as others...
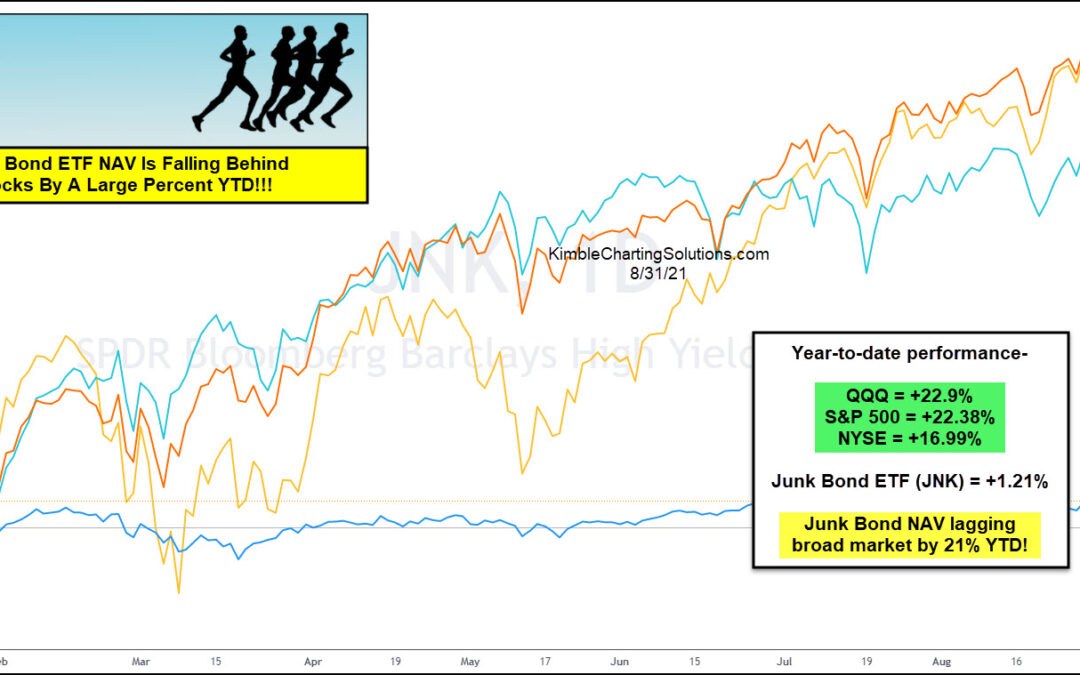
by Chris Kimble | Sep 1, 2021 | Kimble Charting
2021 has been a great year for equity investors. The Nasdaq 100 and S&P 500 ETFs are up between 20 and 25 percent on the year! But while it’s felt like a risk-on kinda year, there’s been one missing ingredient: Junk Bonds. Something isn’t quite right… In today’s...
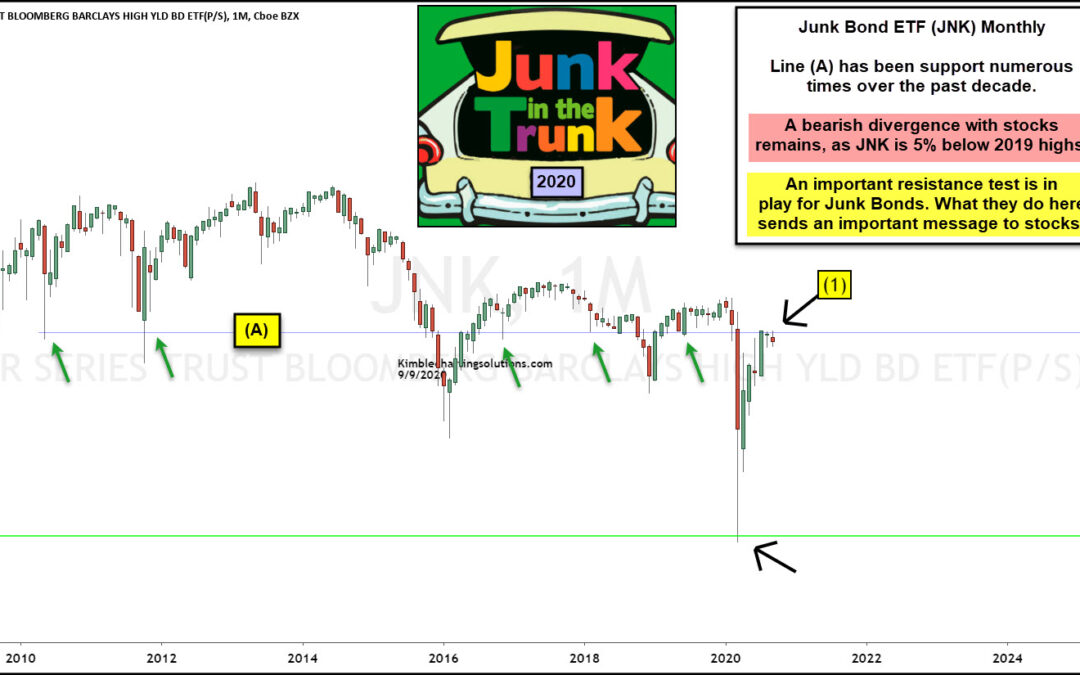
by Chris Kimble | Sep 10, 2020 | Kimble Charting
As investors, we have several tools and indicators at our disposal. Whether it is technical indicators such as Fibonacci levels, moving averages, or price supports, or fundamental indicators such as corporate earnings or economic data, we have a lot of information to...
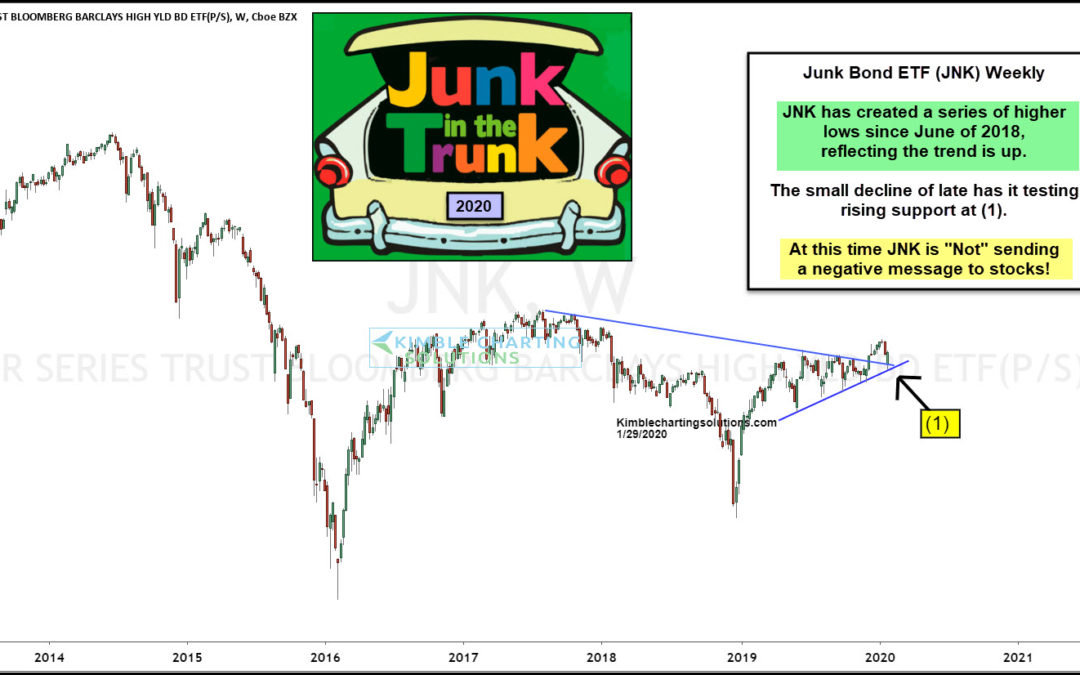
by Chris Kimble | Jan 29, 2020 | Kimble Charting
If the saying “So goes Junk Bonds, So goes stocks” is true, what Junk bonds do in the next couple of weeks could send an important message to stocks! Junk bond ETF (JNK) has created a series of higher lows since June of last year. When JNK moves higher...
