
by Chris Kimble | Jan 23, 2016 | Kimble Charting
One trend is clear, over the past 90-days, stocks have been soft. Below looks at what markets have been the weakest, during the past 90-days. CLICK ON CHART TO ENLARGE The two “downside leaders” are Transports and Small Caps (Russell 2000). So lets take a...
by Chris Kimble | Jan 22, 2016 | Kimble Charting
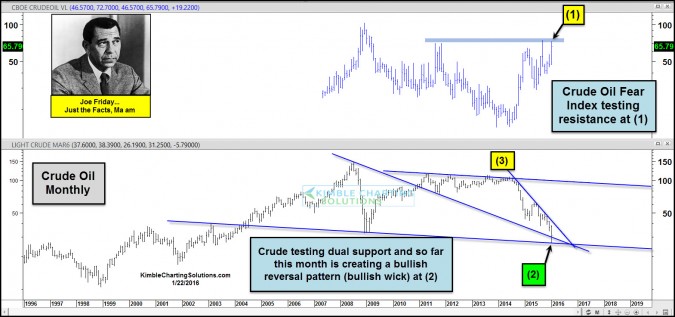
CLICK ON CHART TO ENLARGE The decline in Crude Oil over the past 18-months has been historic, largest 18-month decline ever! Crude remains in our opinion, the most important commodity in the world and its relentless decline is of concern, on a macro basis. The chart...

by Chris Kimble | Jan 21, 2016 | Kimble Charting
Small Caps/Russell 2000 started diverging against the broad market last year (falling more than the S&P). The table below compares the performance of the S&P against the Russell, over the past 6-months. CLICK ON CHART TO ENLARGE Small caps have been almost...

by Chris Kimble | Jan 20, 2016 | Kimble Charting
In an attempt to reduce investor bias and to get a different view of chart patterns, I invert charts (turn them upside down). Two weeks today, ago the Power of the Pattern shared the chart below, reflecting that the Russell 2000 inverted (same pattern for the inverse...

by Chris Kimble | Jan 20, 2016 | Kimble Charting
CLICK ON CHART TO ENLARGE Unless a person lives under a rock, you are well aware that stocks have got off to a rough start this year. Above is our Global 6-pack, which looks at key global markets, on a multi-year basis. Each has created a series of lower highs since...
by Chris Kimble | Jan 15, 2016 | Global Dashboard, Kimble Charting
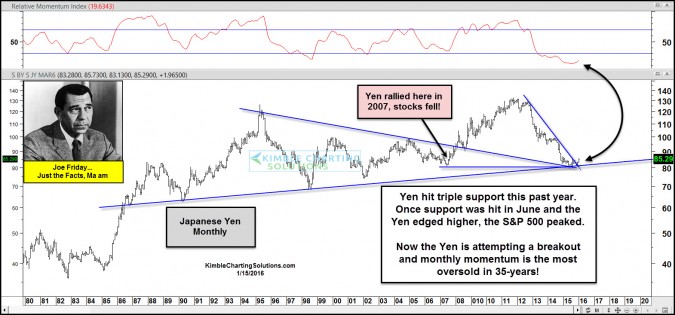
CLICK ON CHART TO ENLARGE We have been sharing the above chart with our Premium, Global Dashboard and Sector members, for the past few months. This chart looks at the Japanese Yen over the past 35-years. In 2007, the Yen took off and stocks around the world tanked....

by Chris Kimble | Jan 14, 2016 | Kimble Charting
CLICK ON CHART TO ENLARGE Last week was rough for stocks, as the S&P 500 opened the year with the “worst first week of the year, ever!” The second week hasn’t been much to brag about, from the bullish camp, as prices have continued to fall. I...

by Chris Kimble | Jan 13, 2016 | Kimble Charting
CLICK ON CHART TO ENLARGE Amazon has been a stellar performer for years, what a great stock to own! The strong rally off of support back in 2015, has pushed AMZN up to channel and Fibonacci 161% extension resistance. While AMZN was near this dual test of resistance,...
