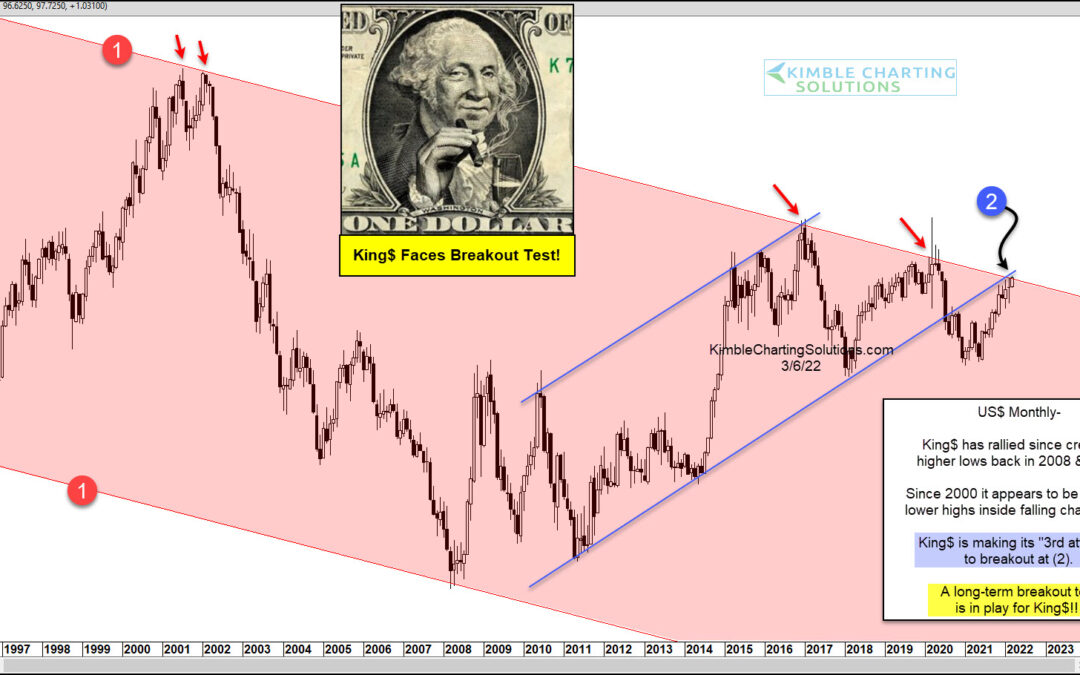
by Chris Kimble | Mar 7, 2022 | Kimble Charting
Over the past few decades, the U.S. Dollar has been weakening. Could this weakness be coming to an end? Today’s long-term “monthly” chart highlights an important test for the U.S. Dollar… and the global financial complex! Here you can see King Dollar has been in a...
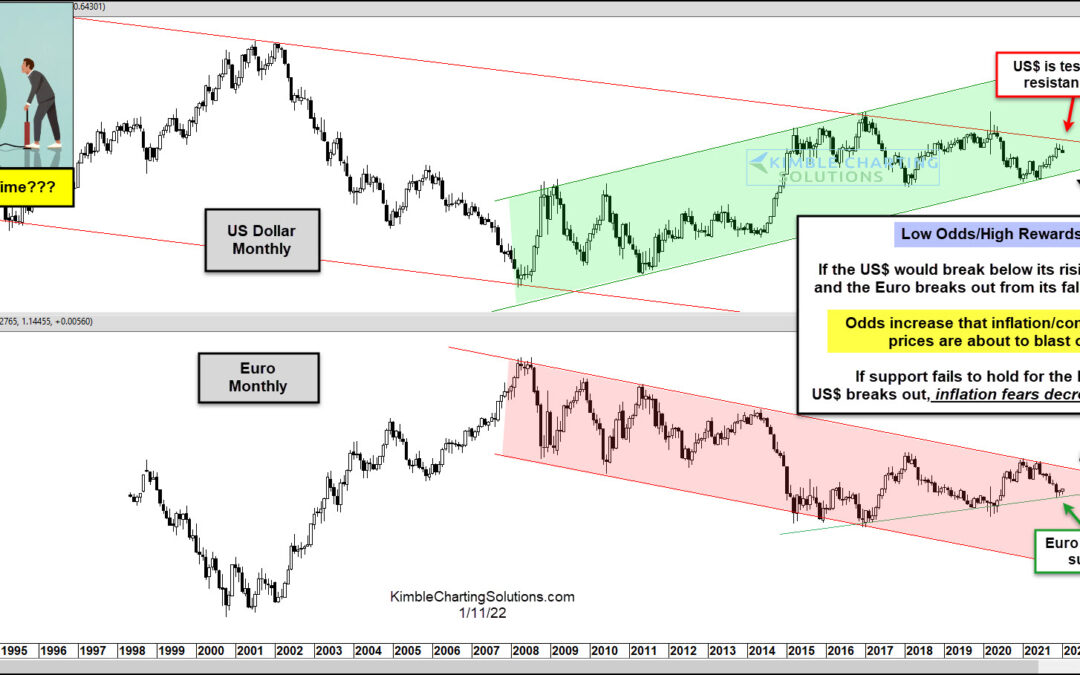
by Chris Kimble | Jan 13, 2022 | Kimble Charting
Current data suggests that inflation has been in our everyday lives for several months. And today’s Producer Price Index data was pretty ugly. BUT… could inflation be peaking? Today’s chart 2-pack offers a glimpse of why inflation could subside over the near-term....
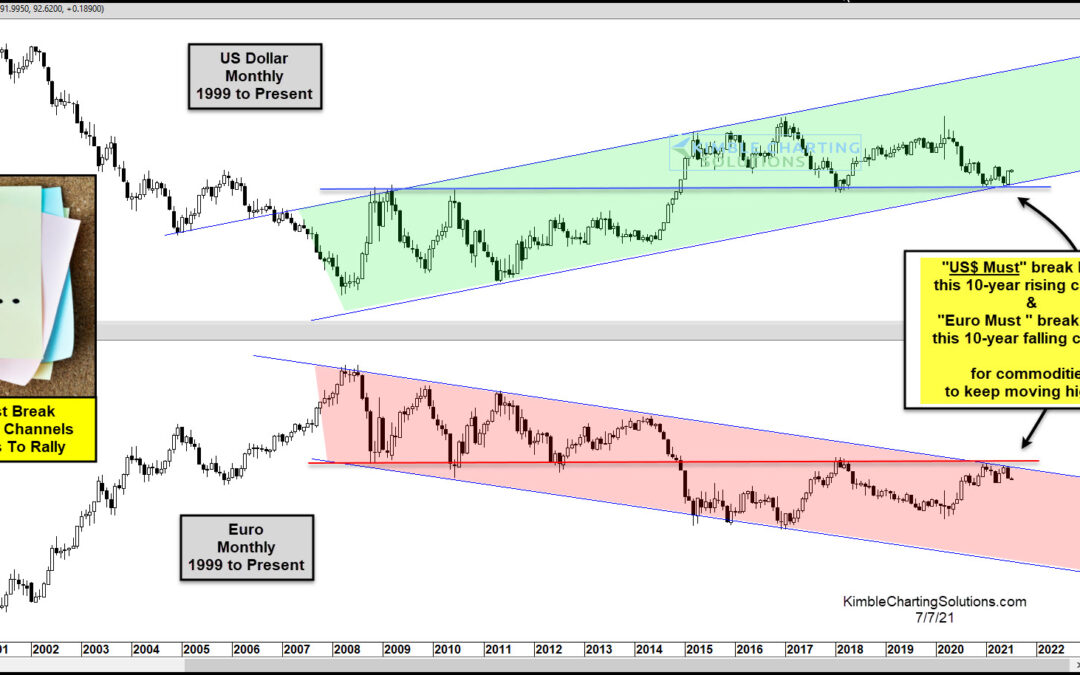
by Chris Kimble | Jul 8, 2021 | Kimble Charting
Inflation pressures are increasing as the economy tries to digest a prolonged period of higher commodity prices. While select commodities have pulled back (and this has investors hopeful that inflation moderates), the broader commodities arena remains elevated. So...
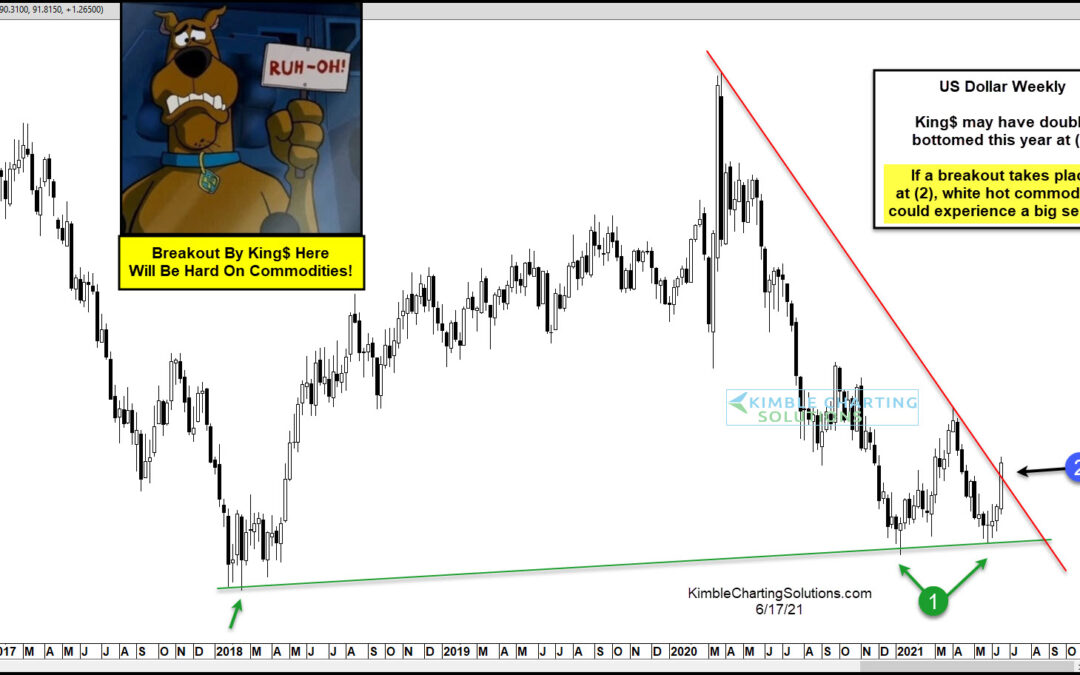
by Chris Kimble | Jun 18, 2021 | Kimble Charting
Rising commodities prices have been all over the news for several months. The rally has been broad-based and persistent. So what could possibly derail the commodities rally? U.S. Dollar strength. King Dollar has not been so king-like over the past several months… but...
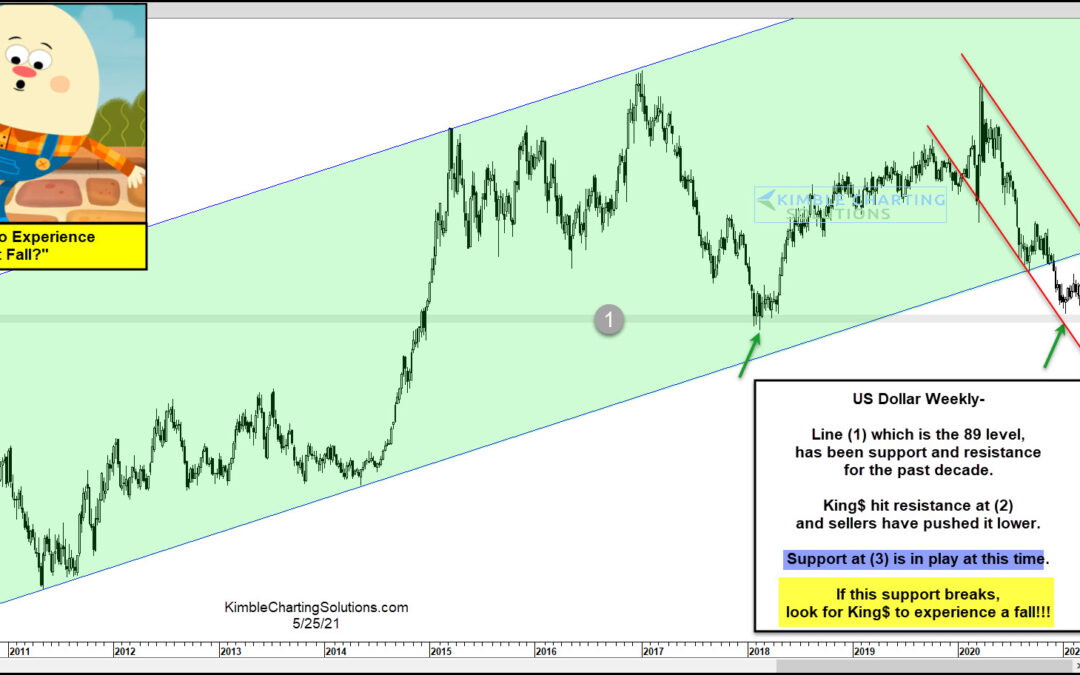
by Chris Kimble | May 25, 2021 | Kimble Charting
Is King$ about to turn into Humpty Dumpty and experience a great fall? Possible! The US$ had remained inside of bullish rising channel for nearly a decade, as it created higher lows and higher highs. Things changed last year as it slipped below rising channel support....
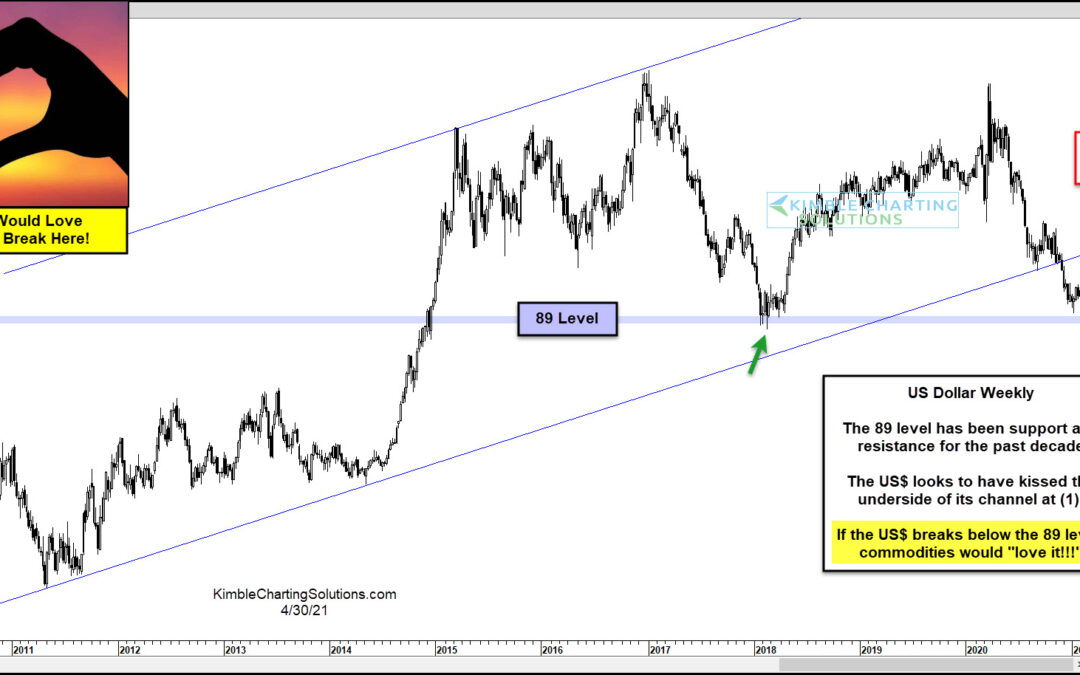
by Chris Kimble | Apr 30, 2021 | Kimble Charting
A weaker US Dollar is a good thing for assets like commodities. So it shouldn’t be any surprise that commodities have been very strong over the past several months while the Dollar has been weak. Today we look at a “weekly” chart of the US Dollar Index and highlight...
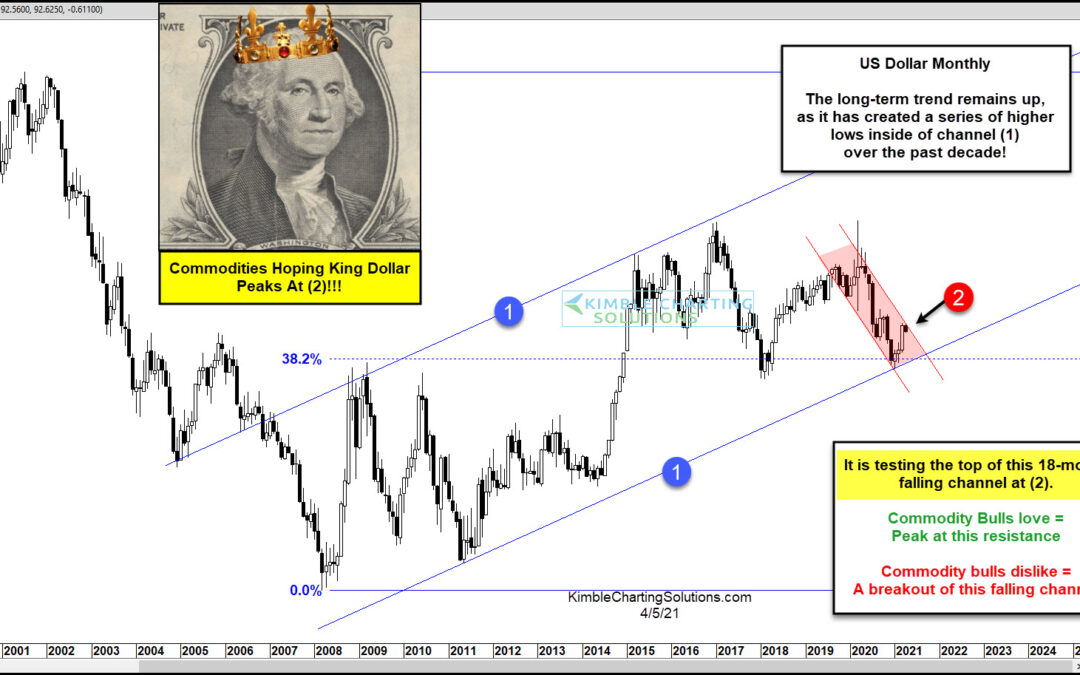
by Chris Kimble | Apr 6, 2021 | Kimble Charting
The US Dollar has received a fair amount of attention over the past year, as pandemic-spurred government stimulus and assistance programs and a softer stance from the Federal Reserve have weakened the buck. And commodity bulls have benefited enjoying a broad rally...
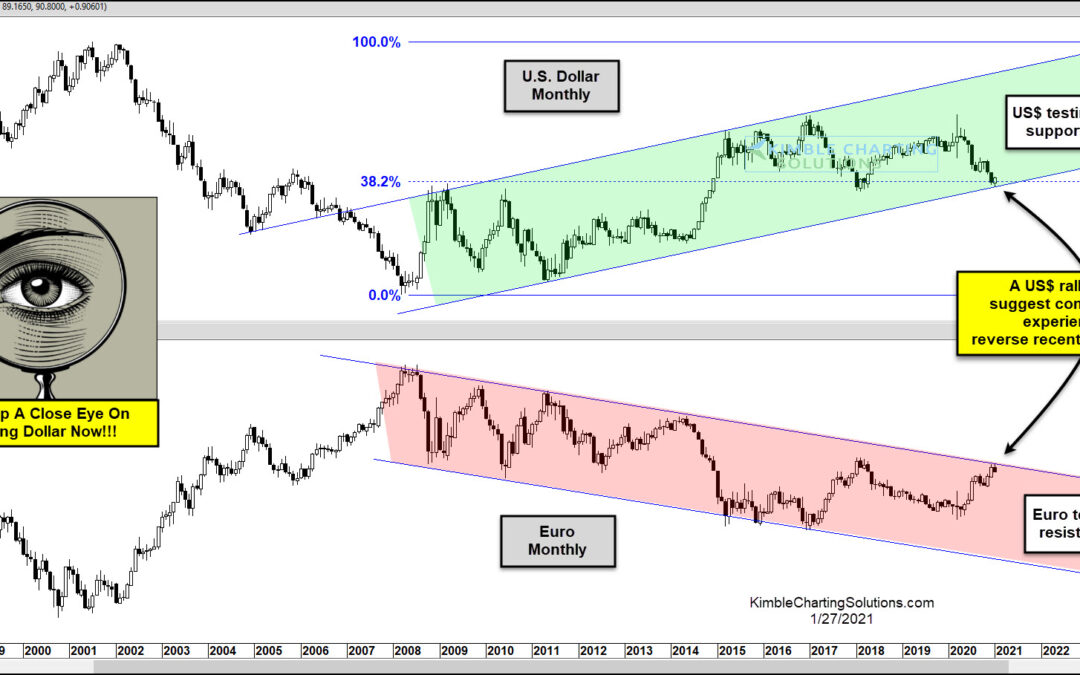
by Chris Kimble | Jan 28, 2021 | Kimble Charting
A lot has happened in the currency markets over the past year. And important near-term trends are currently facing some big-time long-term trend support/resistance levels! In today’s chart 2-pack we take a look at the U.S. Dollar currency index on a “monthly” basis...
